Article
Can you Forecast the Unprecedented?

The threat of catastrophic wildfires is pervasive and exists almost everywhere. The question is whether your risk framework is built to see it coming.
Over the past five years, catastrophic wildfire events have occurred with a frequency and geographic reach that has challenged how electric utilities think about tail risk. The 2020 Labor Day Megafires along the West Coast. The 2021 Pacific Northwest heat dome, which at its peak exceeded temperatures ever recorded in Death Valley. Wildfires in Hawaii. Fires in regions that had no meaningful wildfire history a decade ago.
For risk managers at electric utilities of every size, the pattern raises an uncomfortable question: if events of this magnitude keep occurring, is the framework being used to assess tail risk still calibrated to the environment utilities are actually operating in?
Technosylva Senior Data Scientist Pavel Grechanuk explored this in a recent Utility Dive piece, arguing that the tools exist to forecast these events, and that utilities willing to invest in the right modeling framework can move from being caught off guard to being genuinely prepared.
The Problem with How Tail Risk Gets Calculated
Electric utility risk managers are familiar with recurrence interval language. A 1-in-100 year event. A 1-in-100,000 year event. These designations are meant to convey probability, but they depend entirely on the quality and completeness of the historical record they are drawn from.
When wildfire events occur in regions with little prior fire history, or under weather conditions that exceed anything in the local record, those recurrence intervals become unreliable. The 2021 heat dome is a clear example. According to research published in Nature, that single event accounted for 21 to 34 percent of total area burned in the United States that year. No historical baseline built from the prior decades would have assigned meaningful probability to that outcome.
For a Risk or Finance executive, this creates a specific problem: if the models underpinning your risk assessment do not account for conditions outside the historical norm, your organization may be carrying exposure that is not visible in your current framework.
What a More Complete Framework Looks Like
Pavel’s piece outlines an approach that combines two layers of analysis that are often treated separately.
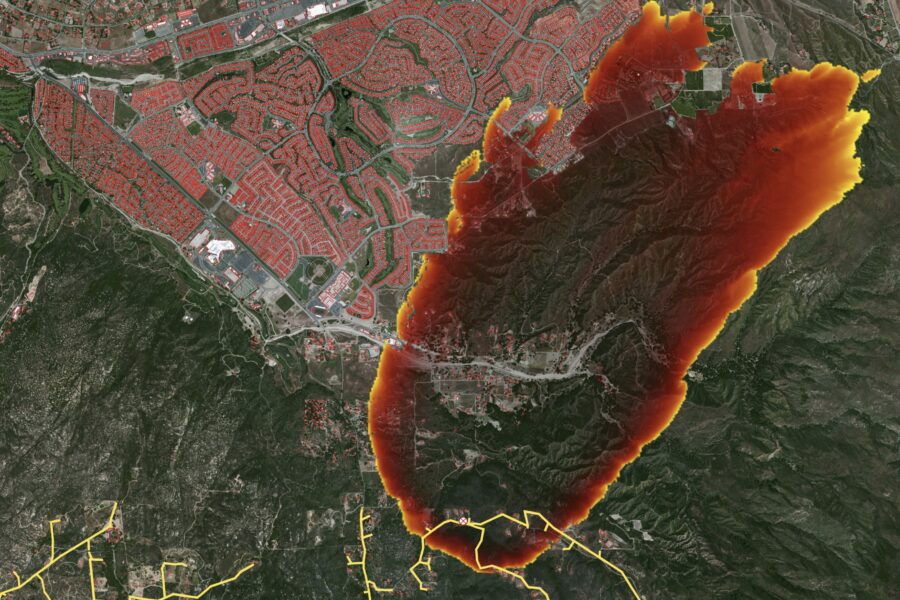
The first is climatological analysis, running historical weather data backward 20 to 30 years across a specific service territory to establish a complete baseline of fire weather variability, from typical low-risk days to the most extreme conditions on record. That baseline is what allows a risk manager to understand whether a forecasted event is routine or whether it sits at the edge of historical experience. The second is operational risk modeling, integrating that climatological baseline with current forecasts, asset data, outage records, and fire spread simulation. The output is not just a risk level. It is a view of where the greatest potential consequences would materialize if a fire were to start, which assets carry the highest probability of ignition under those conditions, and what the downstream impacts on structures, infrastructure, and communities could be.
Together these two layers answer the question that recurrence interval calculations alone cannot: not just how likely is an extreme event, but what would it mean for this utility if one occurred here.
Why This Matters for Enterprise Risk Posture
The regulatory and financial community is moving in a clear direction. Credit agencies, insurers, and state regulators are no longer satisfied with risk assessments that describe exposure in general terms. They are asking utilities to demonstrate that they understand their specific risk, that their mitigation strategies are grounded in data, and that their decision-making during high-risk periods is defensible.
A utility that can show its risk framework accounts for tail risk, not just average conditions, is in a fundamentally different position when those conversations happen. It is not just better operationally prepared. It has a more credible story to tell regulators, a stronger basis for insurance negotiations, and a clearer answer for the board when asked what the organization’s exposure looks like in a worst-case scenario.
What does vary is the internal analytical capacity to build and maintain this kind of modeling framework. The regulatory and financial expectations described here apply across utility sizes, and the path to meeting them looks different depending on the organization.
The events of the past five years have made one thing clear: unprecedented is no longer a satisfying explanation for a catastrophic outcome. The tools to anticipate these events exist. Read Pavel’s full piece in Utility Dive for a deeper look at how climatological analysis and operational risk modeling work together to give utilities a framework for forecasting even the most extreme scenarios.