-
Your Guide to Wildfire Risk and Liability Exposure
This webinar discusses understanding current trends in wildfire behavior and their implications on risk and liability exposure, along with methodologies for risk assessment, mitigation strategies, and tools for real-time monitoring and response to wildfire threats.
Duration: 1 hour
This informative webinar, in collaboration with Utility Dive, explores the tactics utilized by leading electric utilities to forecast, mitigate, and respond to wildfire risks and the associated liability.
As wildfires continue to increase in frequency and severity, they present a significant threat to electric utilities infrastructure and communities. Electric utilities face a risk stemming from their infrastructure to trigger wildfires and the liabilities that come with that.
Electric utilities can adopt proactive measures, such as preemptive power shutdowns to minimize the risk of wildfires and safeguard the areas in their service territory as well as using solutions that can help assess assets for mitigation purposes.
During the session, you will learn from Technosylva:
- Insights into the latest trends and patterns in wildfire behavior, and their implications for risk and liability exposure
- Methodologies for assessing wildfire risk and strategies for implementing effective mitigation measures
- Tools and techniques for real-time monitoring and response to wildfire threats
Speakers
David Buckley
Board Advisor
TechnosylvaScott Purdy
Meteorological Analyst
Technosylva -
Sustained Wind Forecasts from the High-Resolution Rapid Refresh Model: Skill Assessment and Bias Mitigation
-
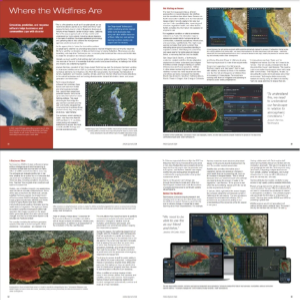
How Downslope Winds Fuel Wildfires

Understanding the wind is the first step to understanding the risk.
Every wildfire season, strong wind events dominate headlines across the western United States. But for electric utility operations teams, the coverage rarely goes deep enough to be useful. Knowing that winds are strong and conditions are dangerous is one thing. Understanding what kind of wind event is driving that risk, how it behaves, and what it means for your specific service territory is what actually informs a good operational decision.
Downslope winds are worth understanding in detail, because they are among the most dangerous fire weather patterns utilities can face.
Local Names, Same Phenomenon
If you work in Southern California, you know them as Santa Ana winds. In Santa Barbara, they are called sundowner winds because they tend to develop around sunset. In northern California, they carry the name Diablo winds. In Colorado, the same dynamics produced the conditions behind the 2021 Marshall Fire. In Hawaii, a downslope windstorm drove the 2023 Lahaina Fire.
The local names differ, but the underlying phenomenon is the same. Downslope winds can occur anywhere in the world where the right terrain conditions exist. For utilities operating outside the traditionally recognized wildfire regions of California, that is an important point. This is not a California-specific hazard. It is a terrain-driven one.
How Downslope Winds Work
The mechanics come down to how air moves over mountainous terrain. When wind flows toward a mountain range, it can either split and move around the obstacle or be forced up and over the top. When it goes over the top, something interesting happens on the other side.
Under the right atmospheric conditions, the descending air on the leeward side encounters a stable air mass that deflects it sharply downward, compressing and accelerating the flow as it races toward the surface. This is the venturi effect, similar to what happens when you cover most of a garden hose nozzle with your thumb. The reduced opening increases both speed and pressure. In a downslope windstorm, the stable air layer aloft acts as that thumb, pinching airflow between the stable layer and the terrain and sending it shooting down the mountain at high speed.
The air that arrives at the surface on the leeward side is not just fast. It is also extremely dry. As air descends from altitude, it warms and loses relative humidity rapidly. The result is a combination of strong winds, very dry air, and vegetation that has been progressively dried out by the sustained wind event, all of which creates conditions that are prime for ignition.
This is also why downslope wind events tend to be more dangerous than other high-wind fire weather patterns. Cold front passages may bring similar wind speeds, but they are typically shorter in duration and often accompanied by some precipitation, which reduces ignition potential. Downslope events can persist for extended periods, continuously drying out fuels and sustaining elevated ignition risk for hours or even days.
What This Means for Utility Operations
The operational implication of downslope wind events is straightforward: a small ignition under these conditions can become a large fire very quickly. The same asset failure that might cause a manageable incident on a calm day can produce a catastrophic outcome when downslope winds are driving rapid spread across dry fuels.
For operations teams, that means the window between identifying elevated risk and needing to act is compressed. Waiting for conditions to develop before making decisions about crew positioning, de-energization, or customer notification is not a viable strategy. Utilities that manage these events well are doing so by identifying areas of concern days in advance, running spread predictions for their specific assets and terrain, and making proactive decisions before the wind arrives.
That level of preparation is achievable for utilities of any size. The same planning tools that help a large utility manage thousands of miles of line can give a smaller utility the circuit-level insight it needs to deploy limited resources where they matter most, make more precise de-energization decisions, and communicate with customers before conditions peak rather than during them.
Understanding what a downslope wind event is, how it behaves, and what it does to fire risk is the foundation for all of that. It turns a weather headline into an operational signal.

-
Predicting wildfire risk: Enhancing fire danger assessment with high-resolution numerical weather modeling.
-
NASA Promotes Technosylva’s Use of Satellite Data for Wildfire Risk Reduction

Technosylva’s wildfire risk modeling gets a boost from space. The company’s innovative approach in leveraging NASA satellite data is featured by NASA in its 2024 Spinoff report, highlighting how space technology tackles real-world challenges. That view from space provides companies like Technosylva with the valuable data needed to confront some of Earth’s greatest challenges.
Public-private partnership in action. This 20-year data collaboration between Technosylva and NASA is a prime example of how government and industry can join forces. Joaquin Ramirez, Technosylva’s President & CTO, said that this is the, “Perfect example of how to work as technologists, bringing the good scientific data to the operational tools.” This work advances the operations for leading wildfire agencies and electric utilities alike.
Space data = smarter firefighting. “NASA provides us with the intelligence and data needed to advance wildfire science,” Ramirez explains. “Thanks to their observations of wildfire and the connection with our fire modeling and science, we can make new models and improve the actual fire behavior models to advance understanding in other places like Europe, Canada, and South America. Previously, that ability did not exist and now, thanks to hotspot data, for instance, we can address the evolving wildfire risks.”
The future of wildfire management. Technosylva’s use of NASA tech isn’t just about today’s fires. It’s about building a robust wildfire risk modeling roadmap for the future. Climate change is intensifying wildfires, making access to accurate, real-time data critical for prevention and mitigation.
Want to learn more? See how Technosylva puts NASA satellite data into action and how leading wildfire agencies and electric utilities are leveraging this science on the ground.
-
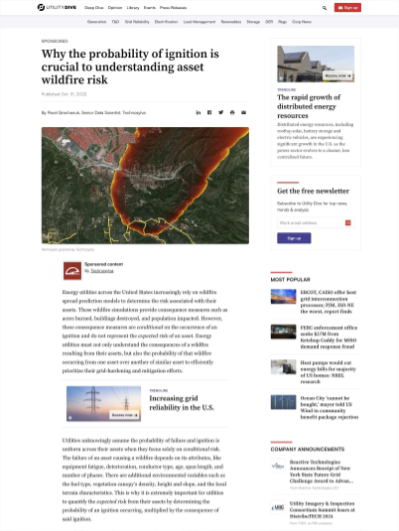
Why Ignition Probability Matters for Asset Risk Prioritization
Electric utilities across the United States are increasingly relying on wildfire spread prediction models to assess the risk associated with their assets. These simulations provide valuable consequence measures: acres burned, structures destroyed, population impacted. But there is an important limitation to keep in mind. Consequence measures are conditional on an ignition already having occurred. On their own, they do not represent the full expected risk of an asset.
To prioritize grid-hardening and mitigation efforts effectively, utilities need to understand not just what could happen if a wildfire starts, but how likely it is that one of their assets starts it.
Why Ignition Probability Varies Across Assets
When utilities focus solely on wildfire consequence, they are implicitly assuming that the probability of ignition is the same across all assets. In practice, it is not. The likelihood that a specific asset fails and causes an ignition depends on a range of factors: equipment age and deterioration, conductor type, span length, number of phases, and environmental conditions such as fuel type, vegetation density, slope, and local terrain. Two assets in the same fire-weather zone can carry very different ignition probabilities depending on their condition and surroundings.
Combining Probability and Consequence
A more complete picture of asset risk comes from combining both factors. Grechanuk outlined this framework in a Utility Dive article: expected risk is calculated by multiplying the probability of ignition by the consequence if that ignition occurs.
Consider two hypothetical circuits during a high-wind event:
Circuit A is heavily hardened, with a 2% probability of ignition and a potential consequence of 100 homes destroyed. Its expected risk: 2 homes (0.02 x 100).
Circuit B is moderately hardened, with a 10% probability of ignition and a potential consequence of 40 homes destroyed. Its expected risk: 4 homes (0.10 x 40).
Ranked by consequence alone, Circuit A appears to be the higher priority by a wide margin. Ranked by expected risk, Circuit B carries twice the exposure. A hardening plan that focuses only on consequence would likely direct resources toward Circuit A, even though Circuit B presents the greater overall risk.
This does not mean consequence should be ignored. Public safety is the central concern, and the potential scale of a fire’s impact matters. But probability without consequence, or consequence without probability, each tell only part of the story. The integration of both is what produces a reliable basis for prioritization.
Implications for Hardening Budgets
Understanding expected risk is important not just for day-to-day operations, but for short- and long-term grid-hardening decisions as well. When prioritization is based primarily on consequence, resources can flow toward assets that have already received significant hardening investment and now carry relatively low ignition probability. The law of diminishing returns applies: each additional dollar invested in an already-hardened asset yields progressively less risk reduction.
Asset hardening decisions are often structured through a risk spend efficiency (RSE) analysis, which weighs the expected reduction in risk against the cost of the mitigation. When RSE is calculated using conditional risk rather than expected risk, it tends to favor areas with the most extreme fire behavior potential regardless of how likely ignition actually is. Accounting for ignition probability helps ensure that hardening investments are directed where they will produce the most meaningful reduction in overall system risk.
Hardening budgets are finite. Whether the funding comes from utilities, ratepayers, or government programs, getting the prioritization right has real consequences for communities, for the environment, and for the utilities responsible for managing that risk.
This article is adapted from a piece originally published in Utility Dive.
-
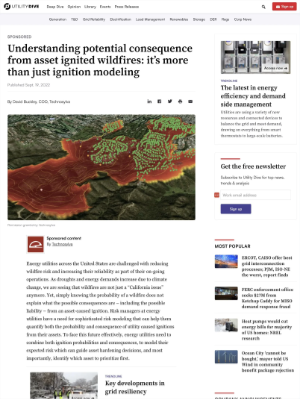
Why Consequence Modeling Belongs at the Center of Asset Hardening Decisions

Simply knowing that an asset could ignite a wildfire is not enough to make a sound hardening decision. Ignition probability tells you where a fire might start. It does not tell you what happens next, or how bad it could get. That distinction matters significantly when hardening budgets are finite and prioritization decisions have real consequences for communities and infrastructure.
As Buckley outlined in a Utility Dive article, ignition is not risk. Risk is the possibility of damage, loss, and harm occurring from an ignition. Two assets with similar ignition probabilities can produce very different outcomes depending on what lies in the potential fire’s path. Understanding that difference is what makes consequence modeling a planning tool, not just an analytical one.
Why Not All Ignitions Are Created Equal
All utility assets carry some probability of failure and ignition. That probability varies based on asset condition, age, design, conductor type, surrounding vegetation, slope, and local weather patterns. But even assets with identical ignition probabilities can pose very different levels of risk depending on where they sit and what a fire starting there would affect.
Consequence modeling addresses this by integrating fire spread prediction with forecasted weather to determine where a fire would travel from a specific asset ignition point and what it would impact along the way. The outputs, structures threatened, population exposed, acreage burned, give planners a concrete basis for comparing assets that ignition probability alone cannot provide.
Not all ignitions are created equal. Not all fires are created equal. Consequence modeling is what makes those differences visible and actionable.
Using Consequence Data to Prioritize Hardening
Once consequence is understood at the asset level, it can be combined with ignition probability to calculate expected risk, the foundational metric for defensible hardening prioritization. But consequence modeling also supports a longer-term planning view that goes beyond a single season or event.
By leveraging weather and landscape data over ten or more years, utilities can identify which assets have been consistently associated with the highest potential consequences from ignition across a range of historical conditions. That longitudinal view separates assets that appear risky in one bad season from those that carry genuine long-term exposure. It is the latter that warrant priority hardening investment.
With consequence data grounding the analysis, any hardening decision can be assigned a quantifiable risk reduction. When that reduction is divided by the cost of the mitigation, the result is a risk spend efficiency (RSE) figure. RSE analysis allows utilities to compare hardening options across their asset portfolio and direct limited resources toward the investments that will reduce overall system risk most effectively per dollar spent.
Regulatory Context and Planning Implications
California’s Public Utility Commission regulations have brought consequence modeling and RSE analysis into formal wildfire mitigation planning requirements for utilities in that state. But the planning value of this approach extends well beyond California. Wildfire-related regulation is expanding in scope and complexity across other states, and the underlying logic, that utilities need to demonstrate not just what they did but why they prioritized it, applies regardless of the specific regulatory framework in place.
On the operational side, consequence data also informs Public Safety Power Shutoff (PSPS) decision-making. Knowing which assets pose the highest expected consequence under forecast conditions gives operators a more defensible basis for de-energization decisions than ignition probability alone.
A More Complete Basis for Investment Decisions
Consequence modeling does not replace engineering judgment or operational expertise. It gives planners and risk managers the information needed to make hardening decisions that are grounded in expected impact rather than visible hazard alone. For utilities building or refining their wildfire mitigation programs, integrating consequence modeling into the prioritization process is what moves asset hardening from reactive to systematic.
This article draws on analysis originally published in Utility Dive by David Buckley, former COO of Technosylva.
-
Technosylva Develops the Methods to Make Fire Simulations Explain Observed and Predicted Events in Real-Time
Fire simulations have greatly improved the way fire agencies and others approach wildland fire management. These tools allow the prediction of how a fire will spread and behave, giving firefighters valuable information for strategic decision-making. However, even with the help of these advanced simulations, there are still limitations and uncertainties that can affect accuracy.
To address this, Technosylva led a 2019 peer-reviewed study, published in the academic journal, Ecological Modelling, demonstrating an innovative method implemented in Wildfire Analyst™ to adjust fire simulations in real-time. The method determines the adjustment factors needed for the optimal rate of spread by fuel model to minimize the arrival time error between the simulated fire and a set of control points where the arrival time of the observed (real) fire is known. The results showed a significant reduction in error and a better fit between the simulated fire growth and the actual fire spread.
“This is a unique simulation mode we have in Wildfire Analyst™ that fire agencies and others can utilize in operational environments. You compare your simulated perimeter with the real fire perimeter coming from satellite platforms, available cameras, or field information. The analysis proved that we can better predict the rate of spread when conditions like convective or erratic wildfire behavior go beyond the modeling by teaching the fire spread model with a mathematical approach to incorporate these unexpected variables.
The advancement is that, while before you needed to calculate this manually through several interactions, now you can do this process automatically. Additionally, you can analyze both error and bias of all this process, therefore improving the process, especially if you are doing it in an operational environment,”

Adrián Cardil, Ph. D
Lead Author & Senior Fire Researcher
Insight from the Research
Fire agencies have turned to fire simulation and modeling as crucial tools to help predict how wildfires will spread and behave under various conditions. This insight aids in the development of strategies and tactics for firefighting and prevention efforts. Numerous fire simulation software tools have been developed over the years, including Farsite, Nexus, FlamMap, BehavePlus, ForeFire, and Wildfire Analyst (WFA).
While these simulations are powerful tools, their accuracy is vital for effective decision-making during wildfire incidents. However, several factors can introduce uncertainties and errors into fire simulations, including limitations and assumptions in the models and uncertainties in input data such as weather, fuel types, and topography. These uncertainties can make simulations deviate from actual fire spread, which can be problematic in real-time firefighting situations.
A Novel Method of Approach
A groundbreaking method implemented in Wildfire Analyst allows for the adjustment of fire simulations in real-time. The objective of this method is to determine adjustment factors that optimize the rate of fire spread according to the specific fuel model, minimizing the error in arrival times compared to observed control points.
The analysis reviews two case studies from Catalonia, Spain, where this method was applied. The study area’s climate is characterized by hot and dry summers with low winter precipitation, making it prone to wildfires. The selected fires, Castell d’Aro and San Llorenç Savall, were closely monitored by firefighters during suppression operations, providing valuable data for testing the adjustment method.
Research Findings
The heart of the method lies in computing Rate of Spread (ROS) adjustment factors for various fuel models involved in fire simulations. These factors are specific to each fuel model and are used to adjust the initial ROS. The adjustment process is based on a least squares approach, aiming to minimize the error between simulated fire growth and real-world observations. The method allows for real-time adjustments and requires minimal input data.
The results of the case studies demonstrate the effectiveness of this approach. Without adjustment, the initial simulations significantly underestimated the actual ROS, particularly at the head of the fires. However, after applying the adjustment factors, the simulated fire spread closely matched the observed fire’s behavior, reducing both time and area errors.
The implications of this method are significant. Firefighters and managers can now have access to more accurate and consistent fire simulations, especially during real-time wildfire situations where quick decisions are crucial. This tool can be used to reconstruct past fires, analyze fire behavior, and support operational planning and decision-making.
While the adjustment method presented in this study is a game-changer for enhancing the accuracy of fire simulations, there are several considerations to keep in mind. It primarily adjusts the fuel models included in the adjustment mode, so the presence of additional fuel models in forward-time simulations may require further adjustments. Factors such as local winds, not considered in initial simulations, can also influence ROS differently in different areas.
Next Steps from the Research
The study’s innovative method for real-time adjustment of fire simulations is a valuable addition to the firefighting toolkit. It addresses the critical need for accurate fire spread predictions in the face of increasingly frequent and severe wildfires. By reducing uncertainties and errors in simulations, it empowers firefighting agencies to make more informed decisions and better protect lives, property, and the environment in the battle against wildfires.
Learn more about how this science is put into practice.
-
Technosylva and CSU Researchers Investigate How to Measure the Survival-Likelihood of Individual Buildings Effected by Wildfire
Wildfire events in California and around the world have resulted in significant social and economic losses. In response, there is strong focus on modeling wildfire behavior in the wildland to aid in developing strategies for fuel reduction and fire suppression. Post-fire observations of several historic fires indicate that within affected communities, some ignitable structures tend to survive even when most in close vicinity have been destroyed. This apparent spatial randomness in damage patterns raises an important question: Can the likelihood of survival of individual buildings be predicted for wildfire events?
What is needed is a more holistic approach that integrates the characteristics of the wildland with the features of the built environment to better predict damage and building loss.
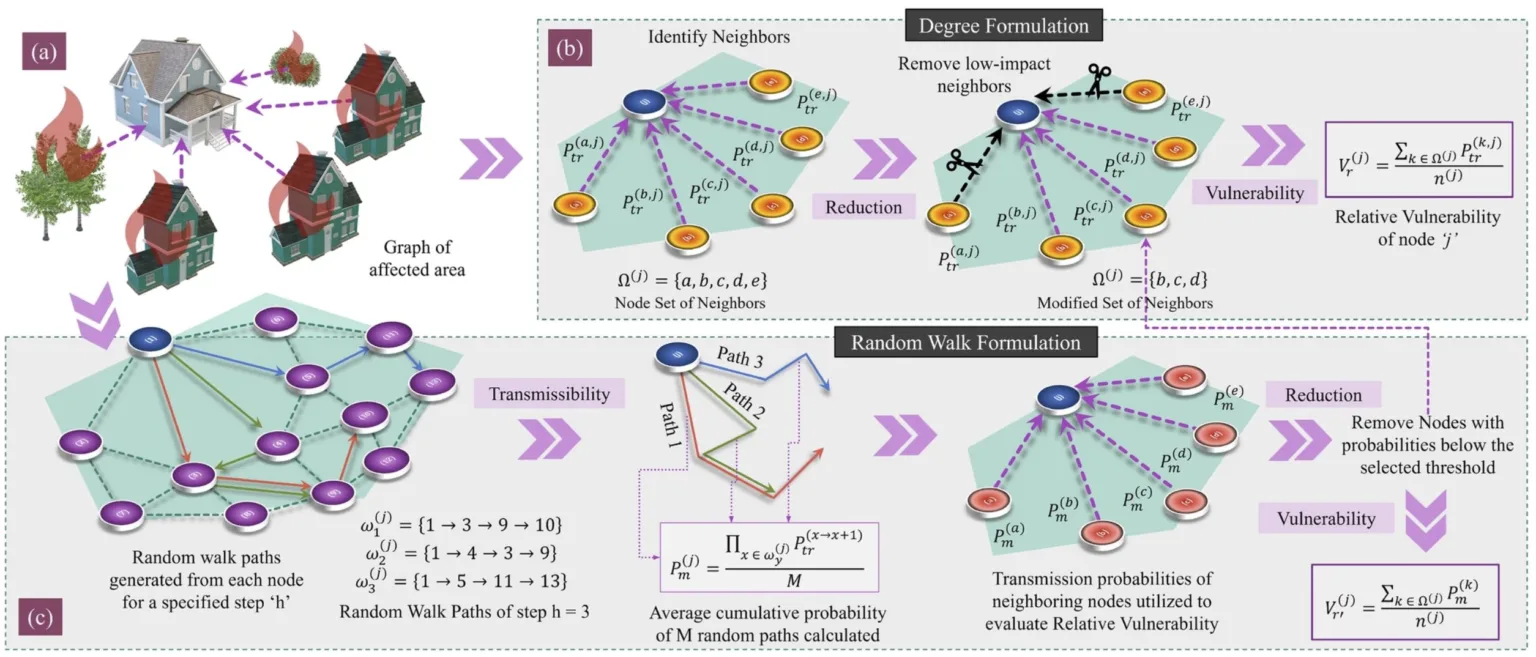
To advance this important modeling goal, Technosylva led a 2022 peer-reviewed study, published in the academic journal, Scientific Reports, that utilized integrated concepts from graph theory to create a relative vulnerability metric that can quantify the survival likelihood of individual buildings within a wildfire-affected region. By emulating the damage observed in historic wildfires the analysis was able to test and refine this framework, resulting in findings showing that both formulations modeling loss at the mid and extreme ranges based on graph centralities were effective in evaluating the vulnerability of buildings relative to each other.
“We wanted to create models that could help to understand, in an operational way, the complexity of the building-to-building risk of fire propagation and try to understand the potential of urban conflagration. This kind of modeling is really complex and we wanted to make the actual models better when we apply fire simulations and ignition impact forecasting to operations. This means moving from empirical models to a little more physics-based models in a way that it could be applied to nation scale or even after global scale. To do that we have to go to the basics of fire and fire behavior and build back out.”

Joaquin Ramirez, Ph.D
Co-Author – President & CTO
Insight from the Research
The study presents an innovative approach to predict the survival of individual buildings during wildfire events by utilizing concepts from graph theory. It addresses a crucial question in the field of fire management: why do some structures within fire-affected communities manage to survive while neighboring buildings succumb to the flames? While traditional wildfire behavior models excel in natural environments, they often fall short in explaining the complex dynamics within built-up areas. This study seeks to bridge that gap by introducing a novel methodology that leverages graph theory to model wildfire propagation within communities.
Cite: Integrated graph measures reveal survival likelihood for buildings in wildfire events
Defining the Modeling in the Research
The research begins by introducing a wildfire graph model, which serves as the foundation of the study. The model represents the intricate interactions between buildings and vegetation in areas affected by wildfires. To enhance the model’s accuracy, the researchers include nodes to account for both wildland vegetation and urban vegetation. These two types of vegetation are recognized as influential factors in determining fire intensity and rate of spread. Additionally, the model incorporates various building features, such as deck type, eaves, roof type, vent type, fence, and window pane, as these factors significantly affect a structure’s vulnerability to wildfires.
Centrality Measures and Building Vulnerability
The core of the study involves evaluating different centrality measures from graph theory to assess the vulnerability of individual buildings within the wildfire-affected community. The traditional centrality measures considered include:
- Closeness Centrality: Measures how close a node is to all other nodes in the network.
- Eigenvector Centrality: Evaluates a node’s influence based on its connections to other influential nodes.
- Clustering Coefficient: Assesses the extent to which a node’s neighbors are connected to each other.
- Gravity Centrality: Determines the importance of nodes based on their spatial distribution within the network.
- Degree Centrality: Measures the number of connections a node has.
- Betweenness Centrality: Identifies nodes that act as bridges between different parts of the network.
The traditional centrality measures are widely accepted in network analysis but were found to have limited accuracy when it comes to predicting building damage in wildfire scenarios.
Novel Formulations for Building Vulnerability
To address the shortcomings of traditional centrality measures, the paper introduces two novel formulations for assessing building vulnerability:
- Modified Degree Formulation: This approach focuses on the influence of nearby nodes. It calculates the relative vulnerability of individual buildings by considering the mean of incoming edge weights from neighboring nodes. Furthermore, it introduces a mechanism to remove low-impact connections, thereby enhancing accuracy.
- Modified Random Walk Formulation: This formulation utilizes random walks to assess the spreading power of nodes within the network. It calculates the relative vulnerability based on the concepts of random walk and information entropy.
Research Findings
The study rigorously tests these novel formulations alongside traditional centrality measures on two historic wildfires, namely the 2018 Camp Fire and the 2020 Glass Fire. The results indicate that the modified degree and random walk formulations outperform traditional centrality measures in predicting building damage. While none of the formulations achieved exceptionally high accuracy, they provided valuable insights into general damage patterns within different regions affected by wildfires.
Next Steps from the Research
The study acknowledges the inherent challenges in modeling wildfire behavior, including aleatory uncertainties (randomness) and limited data availability at the community level. It emphasizes the need for improved models that can account for both aleatoric and epistemic uncertainties, which include factors like local weather effects and the extent of fire spread. While the proposed formulations represent a significant step forward, the authors highlight the complexity of the research problem and the need for further refinement and data collection.
The study offers a promising avenue for better understanding and mitigating the impacts of wildfires on communities. It introduces innovative concepts from graph theory to enhance our ability to predict building survivability in wildfire events, providing valuable tools for fire management and community planning.
Learn more about how this science is put into practice.
-
Technosylva Takes the Science to the Hands of the Firefighters in the Field
Accurately predicting fire spread and behavior on the fire line, where reception for data connectivity is difficult, is highly important. This ability can prevent the loss of human life, improve the success of initial attack, and lead to better understanding of the potential fire behavior that minimizes many risks for firefighters.
To address this, Technosylva led a 2018 peer-reviewed study, published in the academic journal, Ecological Modelling, validating how Technosylva’s Wildfire Analyst™ Pocket Edition leverages well-known mathematical models in the scientific community to achieve this field operations goal. The platform allows firefighters to input data and receive real-time information on fire characteristics and estimated progression, all in a user-friendly 3D map interface.
“This is where we demonstrated that we can, as a technologist, bridge the gap and show what the role of technology can be to the wildfire community. What we did with this firefighter-focused application was to apply all the complex models in our lab and put it into a small application that is free for end-users in the field. This once again highlights Technosylva’s goal of being the bridge between scientists and technologists. The application is very popular for firefighters in the field, with over 11,000 downloads, and is being used officially as part of the NWCG S.130 wildfire training course to advance the risk understanding of future wildland firefighters.”
Joaquin Ramirez, Ph.D
Co-Author – President & CTO
Insight from the Research
The analysis looked at the importance of predicting fire spread and behavior in wildfire management and highlighted a mobile app called Wildfire Analyst Pocket, or WFA Pocket, which is designed to provide real-time analysis and predictions for wildfires. Let’s break down the key points in a conversational summary.
Fire modeling systems, which estimate fire behavior, are crucial for fire management agencies at various levels, from global analysis to local fire assessment and prescribed burns. These fire simulators predict fire spread and behavior under various conditions and provide valuable data for experienced fire managers during firefighting, prevention, and planning efforts. Several established fire simulators have been developed over decades, such as Farsite, FlamMap, BehavePlus, and Wildfire Analyst (WFA).
WFA is a software designed to provide real-time analysis of wildfire behavior and spread, supporting decision-making during firefighting operations. It offers a wide range of data, including fire perimeters, flame length, rate of spread, and more, tied to weather conditions and input data.
Accurate predictions of fire behavior are crucial for preventing loss of life and minimizing damage during wildfire incidents. However, due to a lack of computer access on the fireline, fire agencies couldn’t use these fire simulators effectively.
In response, the Wildfire Analyst Pocket Edition (WFA Pocket) was developed as a mobile app for field use. It aims to estimate fire progression and behavior based on observed conditions, using well-known fire spread models from BehavePlus. This paper describes the development, design, models used, and the primary features of WFA Pocket.
WFA Pocket works on various devices and operating systems, including Android, iOS, Windows, Mac, and Linux, and is available for free. It can function both online and offline, providing real-time calculations and results that are easy to understand.
Cite: Predicting fire spread and behaviour on the fireline. Wildfire analyst pocket: A mobile app for wildland fire prediction
The app has four main sections:
- Map Viewer: This section displays the estimated fire progression on a 3D map, allowing users to interactively modify parameters and observe numeric and graphical results in real-time. It considers various factors, including weather, fuel type, topography, and fuel moisture.
- Results: Here, fire modelers can view various fire behavior outputs, such as flame length, rate of spread, crown fire behavior, fire perimeter, and more.
- Charts: Users can interactively observe how fire behavior changes with different input data, which can be useful for analyzing sensitivity to different conditions.
- Parameters: This section allows users to configure the app, input information about the fire site and incident, and set conditions like wind speed, fuel type, and canopy characteristics.
Research Findings
The study evaluated the robustness of WFA Pocket by comparing its results to those from the well-known fire simulator BehavePlus. The comparison found no significant differences, confirming the reliability of WFA Pocket.
A case study involving the Tubbs Fire demonstrated how WFA Pocket accurately predicted fire behavior, especially in the head of the fire. It estimated a mean rate of spread similar to the actual fire spread. However, it’s essential to note that the accuracy of fire simulations depends on factors like model limitations, input data quality, and the level of spatial variability in the conditions.
Next Steps from the Research
WFA Pocket is a valuable tool for predicting fire behavior in real-time in the field. It provides accurate results and is suitable for a wide range of research and fire management applications. While it has limitations and assumptions, future improvements could enhance its accuracy and capabilities for analyzing fire progression across varying landscapes.
Learn more about how this science is put into practice.
-
Measuring Wildfire Exposure to Communities is Possible in Real Time
Wildfires are a major threat to communities and their impacts can be devastating. That’s why it’s so important to have accurate information about the time and likelihood of a wildfire reaching a particular area. This is where wildfire decision trigger modeling comes into play. It helps fire agencies assess fire exposure and create evacuation plans with enough warning time.
But there’s one key aspect that hasn’t received much attention: input data uncertainty. To address this, Technosylva led a 2019 peer-reviewed study, published in the academic journal, Science of The Total Environment, showcasing a new stochastic fire simulation decision trigger modeling method that considers potential variations in input data to assess the probability of wildland fire impact.
”This was the first time that we tried to apply fire impacts for building consequence modeling instead of evaluating the impacts. For a fire, we wanted to explore how we can better model the vulnerability that a community has in its critical asset in much the same way others model flood impacts to coastal communities at risk. It means asking what is the exposure that you may have from considering the historical conditions on weather and the immediate conditions at the location.
The analysis allows you to model risk associated with an asset’s exposure variable. In this analysis, we explained the method of that risk associated to balance exposure, which is very powerful. We know where the assets are and their individual risk, but we don’t know where the fire is. So, the model can assess asset risk, and with applied weather conditions, we can tell what the exposure of this community would be to a fire and the possible outcome if it was hit. This is a big advantage to fire agency operations for evacuation planning and timing of those decisions.”
Joaquin Ramirez, Ph.D
Lead Author – President & CTO
Insight from the Research
Accurately predicting wildfire behavior is challenging due to uncertainties in input data and the inherent limitations of fire models. Wildfire simulations, which use various models and data to predict fire behavior, have been crucial in managing wildfires. These simulations help fire management agencies plan controlled burns, assess fire risks, and develop real-time strategies for suppression.
Several types of fire spread models have been developed, ranging from physical-based models to empirical and mathematical ones. These models consider various factors like vegetation, weather conditions, and fuel moisture to estimate critical fire behavior parameters such as the rate of spread and flame intensity.
Protecting vulnerable areas, such as wildland-urban interfaces (WUIs), is a primary concern for fire agencies. They need accurate predictions of when and where fires might impact these areas to make informed decisions about evacuations or shelter-in-place strategies. However, the accuracy of such predictions depends on the uncertainty associated with input data, including factors like topography, fuel type, and weather conditions.
To address these challenges, the study presents an innovative approach leveraging wildfire decision trigger modeling. This uses well-established semi-empirical fire spread models and incorporates stochastic elements to simulate decision trigger buffers around areas to be protected. These buffers represent the time it would take for a fire to reach the protected area under various input conditions, providing probabilities of impact.

Cite: Joaquin Ramirez Defining The Modeling in the Research
The model incorporates random elements into a simulation, which better reflects the chaotic and unpredictable nature of wildfires. By using random data inputs, you can produce a range of possible outcomes, rather than just one deterministic prediction. By simulating different scenarios, it produces a probability map of the fire’s arrival to areas that need to be protected.
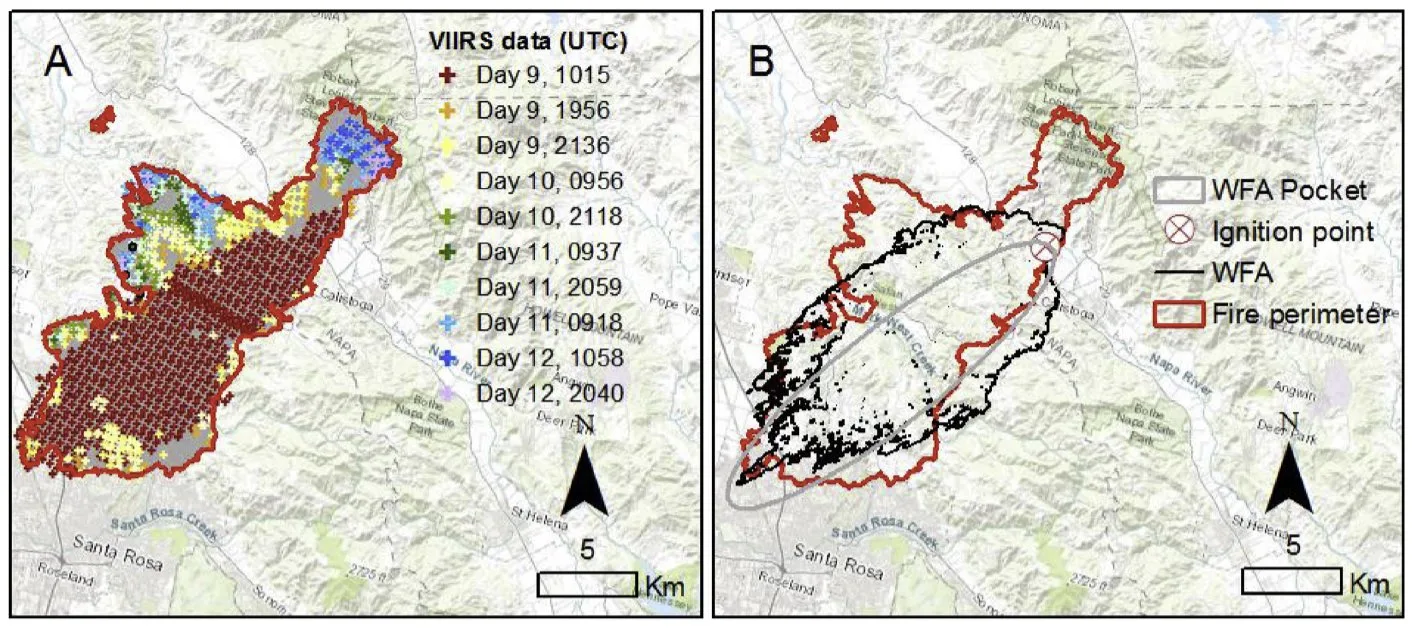
To demonstrate the decision trigger modeling concept, the study used data from the Tubbs fire, one of California’s most destructive wildfires. The analysis ran fire simulations backward in time from selected ignition points to the edge of the WUI around Santa Rosa. The simulations estimated the time it would take for a fire to reach the WUI, and the results were compared with the actual fire progression to validate the accuracy of the decision trigger modeling method.
The decision trigger modeling method uses an ensemble approach, varying input conditions such as wind speed, wind direction, and fuel moisture content to account for input data uncertainties. It generates multiple fire simulations under different conditions to provide probabilistic estimates of fire arrival times.
Research Findings
The study found that the fire simulations using the decision trigger modeling method had a high degree of accuracy when compared to the actual fire spread during the Tubbs fire. The evacuation trigger buffers estimated by decision trigger modeling correctly predicted the time of arrival of the fire at the WUI edge. The ensemble method used for weather conditions showed that the predicted rate of spread (ROS) varied significantly depending on the input conditions. This variability highlighted the importance of considering weather uncertainty in fire behavior modeling.
The decision trigger modeling method offers a valuable framework for estimating the probability of wildfire impact in areas to be protected in real time, accounting for input data uncertainties. It provides decision-makers with information about potential fire spread and the associated probabilities, aiding in evacuation planning and the development of fire suppression strategies.
The study emphasized the need for considering uncertainties beyond weather conditions, including model limitations, fire-atmosphere interactions, and data quality. While the decision trigger modeling method showed promise, it is essential to combine it with expert knowledge and judgment for more accurate decision-making.
Next Steps from the Research
The wildfire decision trigger modeling approach presented in this study offers a novel way to predict wildfire impacts on vulnerable areas. By incorporating input data uncertainties and providing probabilistic estimates,decision trigger modeling enhances decision support for fire management agencies.
However, the study highlights the importance of considering various sources of uncertainty to improve the accuracy of fire behavior predictions in operational environments. Decision trigger modeling has the potential to become a valuable tool for assessing fire risk and protecting communities in the face of increasing wildfire threats.
Learn more about how this science is put into practice.
-
A First Time Validation of Fire Spread Modeling on the Fire Line
Despite California being a major fire hotspot in the Americas, there is no extensive scientific analysis of operational fire spread models allowing analysis of their performance and drivers leading to model inaccuracies. Recent advances in technology have allowed monitoring the fire progression of most wildfires every 15 min in the United States through the National Fireguard Detections platform. This data, when available for use on a fire, provides unprecedented capabilities to analyze factors influencing fire behavior and compare the observed and predicted wildfire rate-of-spread (ROS) modeling in fires distributed across different and complex landscapes.
Building on other studies that analyzed these modeling techniques, Technosylva joined with CALFIRE and led a 2023 peer-reviewed study, published in the International Journal of Wildland Fire that assesses the performance of fire spread models used in California by comparing observed fire growth data with simulated data. The analysis reviewed operational settings under different environmental conditions using 1853 California wildfires from 2019 to 2021 to determine what conditions the current models may over, or underestimate ROS and subsequently, the burned area and associated fire impacts on buildings and other assets.
“It was a great opportunity to analyze these fires because it’s the first time we have had such a data set with its huge number of files and additionally, temporal resolution of that data in polygons every 15 minutes. So, it is unprecedented to have both this amount of fire monitoring data and a fire behavior simulator platform with high-quality inputs, including the fuel types, the weather conditions, canopy characteristics, and other pieces.
The analysis allowed us the opportunity to compare the best fire modeling possible with the best fire monitoring possible. The main conclusion from the analysis was that these models can be used in wildfire operational environments.”
Adrián Cardil, Ph. D
Lead Author & Senior Fire Researcher
Insight from the Research
Wildfire spread models play a crucial role in predicting how fires propagate, but their accuracy is influenced by various factors, including fuel availability, topography, and weather. Among these models, Rothermel’s semi-empirical model has been widely used for its simplicity and computational efficiency. However, the inherent limitations and assumptions of these models, along with input data quality, can impact their reliability.
This study, conducted in California, aimed to assess the predictive accuracy of wildfire spread models under different environmental conditions. It utilized high-resolution data from the National Fireguard Detections product to compare observed and predicted Rates of Spread (ROS) for 1853 wildfires occurring from 2019 to 2021. The analysis sought to identify conditions under which the models overestimate or underestimate ROS, ultimately affecting the burned area and fire impacts on buildings and assets.

Cite: Adrián Cardil Key observations and findings from the Research
- Fire Progression Data: The study used the National Fireguard Detections product data, offering high temporal resolution to monitor fire progression every 15 minutes. A grid-growing clustering algorithm was employed to classify polygons into individual fire incidents, enabling a quantitative analysis of fire behavior.
- Fire Modeling with WFA-e: Fire simulations were conducted using WFA-e, incorporating various fire spread models, including Rothermel’s surface and crown fire spread models. Fuel type, topography, and weather data were integrated to run simulations.
- Statistical Analysis: The accuracy of the fire spread models was assessed using error metrics such as ROS residuals, mean absolute error (MAE), mean bias error (MBE), and mean absolute percentage error (MAPE).
- Environmental Factors: The study revealed that the accuracy of fire spread predictions was influenced by environmental variables such as wind speed and fuel moisture content (both live and dead). Low wind speeds and high fuel moisture levels tended to lead to underestimations of ROS, while high wind speeds resulted in overestimations.
- Fuel Types: Different fuel types played a significant role in the accuracy of predictions. Models performed relatively well for shrub, grass, and grass-shrub fuel types, while they consistently underpredicted ROS for timber fuel types.
- Overall Model Accuracy: The models had an average MAPE of 47% for automatic fire simulations, with better performance in shrub, grass, and grass-shrub fuel types. Timber fuel types exhibited the highest MAPE (approximately 67%).
The study found that the model errors and biases were reasonable for simulations performed automatically. It identified environmental variables that might bias ROS predictions, particularly in timber areas where some fuel models might underestimate ROS. Overall, the performance of fire spread models for California aligns with studies developed in other regions, and the models are deemed accurate enough to be used in real-time to assess initial attack fires.
Next Steps from the Research
The study highlighted challenges related to pyroconvection, local wind fields, and the estimation of ROS in timber areas. It recommended the development of improved fire spread models to address these challenges and enhance prediction accuracy.
The study found that while current fire spread models have limitations and biases, they are accurate enough to be used in real-time operational settings, particularly with the capability for manual adjustments and calibration. However, there is a need for ongoing improvements, especially for modeling fire spread in timber areas, predicting crown fire behavior, and considering the effects of pyroconvection. This research contributes valuable insights to wildfire prediction and management, emphasizing the importance of continuously refining and enhancing predictive models in the face of growing wildfire threats.
The research underscores the importance of wildfire simulators in supporting planning and incident analysis in real-time, despite the potential uncertainties derived from input data quality and model inaccuracies. The study additionally provides insights into the performance of fire spread models in California, offering a foundation for understanding and potentially improving upon current operational models in the future.
Learn more about how this science is put into practice.