-
Beyond Static Assessments: Why Dynamic Wildfire Risk Analysis is Critical to Utility Wildfire Mitigation

“Fire is dynamic. Utilities must evolve beyond static assessments to stay ahead of the threat.”
Electric utilities of every size, from large investor-owned utilities to small cooperatives and municipal providers, are facing the same fundamental challenge: wildfire risk evolves faster than any fixed assessment can capture. The tools that worked in the past may no longer be enough.
Traditional, static risk assessments have long been a cornerstone of wildfire mitigation planning. They are detailed, methodical, and well-intentioned. But they are built on historical data, terrain analysis, fuel assessments, and scenario modeling, a fixed snapshot of conditions that may have existed months or even years ago. By the time a static assessment is completed, it is already out of date. And for a utility making operational decisions today, that gap matters.The Limits of a Static Risk Assessment
Wildfire risk shifts constantly. Weather patterns change season to season, month to month, day to day, and even hour to hour. Fuel moisture levels fluctuate. Vegetation conditions evolve. A service territory that carried moderate risk last fall may look very different after a dry winter and an early heat event.
Relying on a static assessment to guide real-time decisions is like navigating with a map that was printed before the roads changed. For a large utility with thousands of miles of line, that gap creates blind spots. For a smaller utility with limited staff and tighter resources, it can mean making critical calls, on de-energization, crew positioning, customer notification, without a current picture of actual conditions.
The consequences of that gap are not theoretical. Utility-caused ignitions during periods of elevated but undetected risk have resulted in catastrophic outcomes for communities and lasting financial and operational consequences for the utilities involved.
What Dynamic Risk Analysis Does Differently
Dynamic risk analysis builds on the foundation of a static assessment by layering in real-time and forecasted weather data, current fuel conditions, and continuous fire behavior modeling. The result is a living view of risk, one that updates as conditions change and supports decisions across both planning and day-to-day operations.
For utilities at any scale, this approach delivers several concrete operational advantages.
It reduces the likelihood of ignitions by enabling proactive mitigation tied to actual current conditions rather than historical averages. When a utility can see elevated risk developing days in advance, it can act before conditions become critical.
It supports more precise Public Safety Power Shutoff (PSPS) decisions. Rather than applying broad de-energization across wide areas in response to a Red Flag Warning, utilities can identify the specific circuits where risk is genuinely elevated and focus action there. This matters enormously for smaller utilities, where a wide-area shutoff can disproportionately impact customers and strain limited restoration resources.
It improves how resources get deployed. Crew pre-positioning, equipment staging, and inspection prioritization all become more defensible and more effective when grounded in current risk data rather than assumptions.
It strengthens communication with customers, regulators, and community partners. When a utility can explain its decisions with real data, it builds the kind of trust that is difficult to establish any other way.
What Effective Dynamic Analysis Requires
Not all dynamic risk tools are equal. To be operationally useful, a dynamic risk analysis capability needs to include three core components.
First, wildfire ignition and spread simulation. Understanding not just where an ignition might occur, but where a resulting fire could travel and what it could impact, is essential for calibrating operational response.
Second, a real-time view of current conditions. Integrating live weather data and fuel moisture levels gives operators an accurate, up-to-date picture of risk across their service territory at any given moment.
Third, forward-looking forecasting. Knowing that risk is likely to spike in 48 or 72 hours allows utilities to prepare, not just react. For smaller utilities that may not have round-the-clock meteorological support, access to reliable forecasted risk data can be particularly valuable in closing that gap.
The Bottom Line
Static assessments serve a purpose. They establish a baseline, support regulatory filings, and document a utility’s understanding of its risk landscape. But they were never designed to drive real-time operational decisions.
Every utility that faces ignition risk, regardless of size, geography, or regulatory environment, needs a current view of that risk. Dynamic analysis is how that view gets built and maintained. The utilities making the strongest operational decisions today are the ones that stopped relying on a map that stopped being accurate the moment it was printed.

-
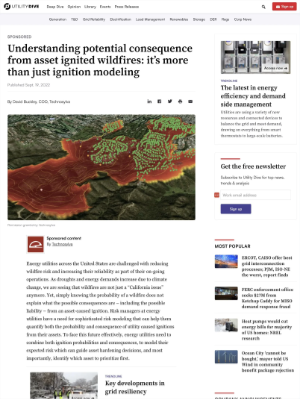
Put Your Wildfire Risk into Context
Electric companies need to leverage a comprehensive understanding of their asset wildfire risk to plan for a safer future. With applied technology, they can reconstruct past fire seasons to truly define outlier events and model the consequences of asset-caused ignitions to identify trends and patterns that better prepare them for future wildfire risks. A shifting regulatory and legal landscape around wildfire liability is requiring electric companies to think differently about risk.
“Attempting to forecast wildfire risk without using past events as a baseline is like analyzing a single data point without any reference.“

Attempting to forecast wildfire risk without using past events as a baseline is like analyzing a single data point without any reference. Technosylva’s Senior Data Scientist, Pavel Grechanuk, discussed in Electric Perspectives Magazine the importance of using the data of historical fire seasons to prepare for future extreme weather events. He emphasizes that electric companies must not only analyze simulated wildfire consequences, but also understand the likelihood of their assets igniting wildfires. By constructing dynamic models and analyzing past events, electric companies can gain a comprehensive understanding of their assets’ wildfire risk.
This approach allows for proactive measures to be taken across operations and mitigation to address the impact of future extreme weather events. The use of historical data also allows for the identification of trends and patterns, providing valuable insights into where the risk of wildfire and its impacts to communities truly exists across an electric company’s service area. By understanding the expected risk from their assets across a historic timeline view of “unprecedented” outliers, utilities can efficiently prioritize grid-hardening and mitigation efforts, making the best use of their limited budget resources and regulatory processes.
Furthermore, by contextualizing future events with a robust database of historical risks, electric companies can effectively monitor the frequency and intensity of weather events and identify specific assets along their lines that will be most impacted by climate change. This proactive approach to risk management not only ensures the safety of assets and communities, but also helps in minimizing the potential consequences of asset-caused wildfires.
Learn how you can predict, mitigate, and prevent your evolving wildfire risk and additionally, how Technosylva solutions provide leading electric utilities with increased risk management, operations, asset mitigation, emergency planning, regulatory compliance, and improved public safety.
You can read the full article in Electric Perspectives Magazine here.
-
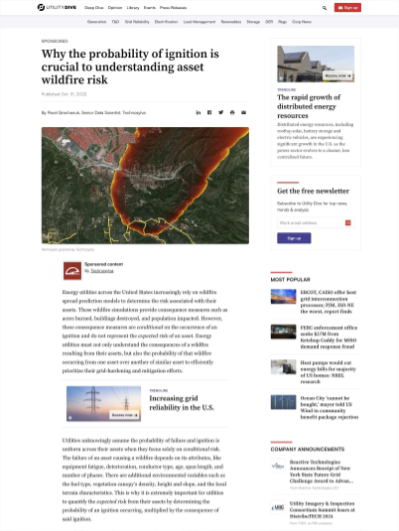
Why Ignition Probability Matters for Asset Risk Prioritization
Electric utilities across the United States are increasingly relying on wildfire spread prediction models to assess the risk associated with their assets. These simulations provide valuable consequence measures: acres burned, structures destroyed, population impacted. But there is an important limitation to keep in mind. Consequence measures are conditional on an ignition already having occurred. On their own, they do not represent the full expected risk of an asset.
To prioritize grid-hardening and mitigation efforts effectively, utilities need to understand not just what could happen if a wildfire starts, but how likely it is that one of their assets starts it.
Why Ignition Probability Varies Across Assets
When utilities focus solely on wildfire consequence, they are implicitly assuming that the probability of ignition is the same across all assets. In practice, it is not. The likelihood that a specific asset fails and causes an ignition depends on a range of factors: equipment age and deterioration, conductor type, span length, number of phases, and environmental conditions such as fuel type, vegetation density, slope, and local terrain. Two assets in the same fire-weather zone can carry very different ignition probabilities depending on their condition and surroundings.
Combining Probability and Consequence
A more complete picture of asset risk comes from combining both factors. Grechanuk outlined this framework in a Utility Dive article: expected risk is calculated by multiplying the probability of ignition by the consequence if that ignition occurs.
Consider two hypothetical circuits during a high-wind event:
Circuit A is heavily hardened, with a 2% probability of ignition and a potential consequence of 100 homes destroyed. Its expected risk: 2 homes (0.02 x 100).
Circuit B is moderately hardened, with a 10% probability of ignition and a potential consequence of 40 homes destroyed. Its expected risk: 4 homes (0.10 x 40).
Ranked by consequence alone, Circuit A appears to be the higher priority by a wide margin. Ranked by expected risk, Circuit B carries twice the exposure. A hardening plan that focuses only on consequence would likely direct resources toward Circuit A, even though Circuit B presents the greater overall risk.
This does not mean consequence should be ignored. Public safety is the central concern, and the potential scale of a fire’s impact matters. But probability without consequence, or consequence without probability, each tell only part of the story. The integration of both is what produces a reliable basis for prioritization.
Implications for Hardening Budgets
Understanding expected risk is important not just for day-to-day operations, but for short- and long-term grid-hardening decisions as well. When prioritization is based primarily on consequence, resources can flow toward assets that have already received significant hardening investment and now carry relatively low ignition probability. The law of diminishing returns applies: each additional dollar invested in an already-hardened asset yields progressively less risk reduction.
Asset hardening decisions are often structured through a risk spend efficiency (RSE) analysis, which weighs the expected reduction in risk against the cost of the mitigation. When RSE is calculated using conditional risk rather than expected risk, it tends to favor areas with the most extreme fire behavior potential regardless of how likely ignition actually is. Accounting for ignition probability helps ensure that hardening investments are directed where they will produce the most meaningful reduction in overall system risk.
Hardening budgets are finite. Whether the funding comes from utilities, ratepayers, or government programs, getting the prioritization right has real consequences for communities, for the environment, and for the utilities responsible for managing that risk.
This article is adapted from a piece originally published in Utility Dive.
-
Can you Forecast the Unprecedented?

The threat of catastrophic wildfires is pervasive and exists almost everywhere. The question is whether your risk framework is built to see it coming.
Over the past five years, catastrophic wildfire events have occurred with a frequency and geographic reach that has challenged how electric utilities think about tail risk. The 2020 Labor Day Megafires along the West Coast. The 2021 Pacific Northwest heat dome, which at its peak exceeded temperatures ever recorded in Death Valley. Wildfires in Hawaii. Fires in regions that had no meaningful wildfire history a decade ago.
For risk managers at electric utilities of every size, the pattern raises an uncomfortable question: if events of this magnitude keep occurring, is the framework being used to assess tail risk still calibrated to the environment utilities are actually operating in?
Technosylva Senior Data Scientist Pavel Grechanuk explored this in a recent Utility Dive piece, arguing that the tools exist to forecast these events, and that utilities willing to invest in the right modeling framework can move from being caught off guard to being genuinely prepared.
The Problem with How Tail Risk Gets Calculated
Electric utility risk managers are familiar with recurrence interval language. A 1-in-100 year event. A 1-in-100,000 year event. These designations are meant to convey probability, but they depend entirely on the quality and completeness of the historical record they are drawn from.
When wildfire events occur in regions with little prior fire history, or under weather conditions that exceed anything in the local record, those recurrence intervals become unreliable. The 2021 heat dome is a clear example. According to research published in Nature, that single event accounted for 21 to 34 percent of total area burned in the United States that year. No historical baseline built from the prior decades would have assigned meaningful probability to that outcome.
For a Risk or Finance executive, this creates a specific problem: if the models underpinning your risk assessment do not account for conditions outside the historical norm, your organization may be carrying exposure that is not visible in your current framework.
What a More Complete Framework Looks Like
Pavel’s piece outlines an approach that combines two layers of analysis that are often treated separately.
The first is climatological analysis, running historical weather data backward 20 to 30 years across a specific service territory to establish a complete baseline of fire weather variability, from typical low-risk days to the most extreme conditions on record. That baseline is what allows a risk manager to understand whether a forecasted event is routine or whether it sits at the edge of historical experience. The second is operational risk modeling, integrating that climatological baseline with current forecasts, asset data, outage records, and fire spread simulation. The output is not just a risk level. It is a view of where the greatest potential consequences would materialize if a fire were to start, which assets carry the highest probability of ignition under those conditions, and what the downstream impacts on structures, infrastructure, and communities could be.
Together these two layers answer the question that recurrence interval calculations alone cannot: not just how likely is an extreme event, but what would it mean for this utility if one occurred here.
Why This Matters for Enterprise Risk Posture
The regulatory and financial community is moving in a clear direction. Credit agencies, insurers, and state regulators are no longer satisfied with risk assessments that describe exposure in general terms. They are asking utilities to demonstrate that they understand their specific risk, that their mitigation strategies are grounded in data, and that their decision-making during high-risk periods is defensible.
A utility that can show its risk framework accounts for tail risk, not just average conditions, is in a fundamentally different position when those conversations happen. It is not just better operationally prepared. It has a more credible story to tell regulators, a stronger basis for insurance negotiations, and a clearer answer for the board when asked what the organization’s exposure looks like in a worst-case scenario.
What does vary is the internal analytical capacity to build and maintain this kind of modeling framework. The regulatory and financial expectations described here apply across utility sizes, and the path to meeting them looks different depending on the organization.
The events of the past five years have made one thing clear: unprecedented is no longer a satisfying explanation for a catastrophic outcome. The tools to anticipate these events exist. Read Pavel’s full piece in Utility Dive for a deeper look at how climatological analysis and operational risk modeling work together to give utilities a framework for forecasting even the most extreme scenarios.
-
Red Flag Warnings Are Helpful but Not the Whole Story

They warn of fire spread, but electric utilities need to know where fires will start.
Red Flag Warnings are a familiar part of wildfire season for anyone working in electric utility operations. When the National Weather Service issues one, it signals that weather conditions are favorable for fire spread: low humidity, dry fuels, and often strong winds. For the general public, that warning is important and actionable. For electric utility risk managers, it is a starting point, not a finish line.
The gap between what a Red Flag Warning tells you and what you actually need to know to protect your infrastructure is where the real risk lives.
Spread vs. Start: Why the Difference Matters
Red Flag Warnings are primarily designed to communicate conditions that allow existing fires to spread rapidly. That is valuable information, but it addresses a different problem than the one utilities are most responsible for managing.
An electric utility’s core concern is ignition. Specifically, whether one of its assets could start a fire. And the conditions that create ignition risk at the circuit level do not always align with the conditions that drive a Red Flag Warning. An asset failure during moderate wind on a day with critically dry fuels and low humidity can spark a fire just as devastating as one that starts under headline-grabbing conditions. Basing operational decisions solely on whether a Red Flag Warning has been issued can lead to both overreaction on broad, low-specificity warning days and underreaction on days where localized ignition risk is genuinely elevated but the warning threshold has not been met.
For utilities of any size, that mismatch carries real consequences. A cooperative serving a rural territory with limited crew resources cannot afford to deploy broadly on every warning day, nor can it afford to miss the days that actually matter.
The Hidden Complexity of Dry Lightning
One of the clearest examples of where Red Flag Warnings fall short for utility operations is dry lightning. Dry lightning, lightning that strikes without significant accompanying rainfall, sits within the Red Flag Warning framework but represents a fundamentally different risk profile than wind and humidity driven warnings.
When dry lightning is the primary hazard, the concern is not one ignition spreading rapidly. It is the potential for numerous simultaneous ignitions across a wide area, any one of which could overwhelm response resources regardless of wind speed. That scenario requires a completely different operational response, including different crew positioning, different communication protocols, and different decisions about de-energization. Treating a dry lightning warning the same way as a wind-driven Red Flag Warning leaves utilities underprepared for one of the more dangerous ignition scenarios they can face.
What Granular Risk Intelligence Provides
The operational gap created by broad public warnings can be closed with more precise, localized risk data. Rather than asking “is there a Red Flag Warning today,” utility risk managers benefit most from asking where, specifically within their service territory, is ignition risk elevated, which assets are most exposed, and what conditions are driving that exposure.
Circuit-level risk intelligence, grounded in real-time weather data, fuel conditions, terrain analysis, and ignition modeling, gives utilities the specificity they need to make proportionate decisions. That means a smaller utility can deploy its limited crews to the areas that actually need attention rather than spreading thin across a broad warning zone. It means a PSPS decision can be surgical rather than sweeping. And it means the reasoning behind every operational call is documented and defensible.
How to Move Beyond the Warning
Red Flag Warnings should remain part of every utility’s situational awareness. They are not the problem. The problem is treating them as sufficient on their own.
Utility risk managers can close the gap by training operations teams to ask deeper questions when warnings are issued: what type of warning is this, what specific conditions are driving it, and how does that map to actual exposure across our service territory? Supplementing public warnings with granular, utility-specific risk data turns a general alert into an actionable operational brief.
The utilities that manage wildfire risk most effectively are not the ones that react to warnings. They are the ones that already know what is happening in their territory before the warning is issued, and have a plan in place before conditions peak.
-
Are you Forecasting and Managing Actual Wildfire Risk?

To protect infrastructure and communities in an increasingly wildfire-prone environment, utilities need a new approach.
Knowing that conditions are hot, dry, and windy is useful. But for an electric utility trying to protect its infrastructure and the communities it serves, it is not enough. Weather conditions describe the environment. They do not tell you which of your assets is most likely to cause an ignition, where a resulting fire would travel, or how many people and structures could be in its path.
That distinction, between knowing conditions and understanding consequence, is at the center of how leading utilities are rethinking wildfire risk management.
The Limits of Weather-Centric Risk Assessment
Red Flag Warnings and standard weather forecasts are essential inputs for situational awareness. No utility should ignore them. But they were designed to serve a broad public safety function, not to drive circuit-level operational decisions.
The core limitation is one of translation. A forecast tells you that wind speeds will reach 40 mph and relative humidity will drop to 10 percent. What it does not tell you is which specific assets in your service territory are most exposed under those conditions, how a fire starting at any one of those assets would behave given local fuels and terrain, or what the potential impact to structures, roads, and populations would be if that fire spread.
For utilities of any size, making operational decisions without that layer of analysis means working with incomplete information. For smaller utilities with limited staff and budgets, it also means that every response, whether deploying crews, initiating a PSPS, or accelerating vegetation management, carries more risk of being either too broad or too narrow.
What Consequence-Driven Risk Assessment Looks Like
The utilities closing this gap are doing so by integrating weather forecast data with fire behavior modeling that is specific to their service territory. Rather than waiting for a warning and then reacting, they are running simulations days in advance that account for forecasted weather, local fuel moisture and fuel type, topography, and asset locations.
The output is not a general risk level. It is a granular, asset-by-asset view of where ignition potential is elevated, where a fire starting from a specific asset would likely spread, and what the potential consequences of that spread would be in terms of structures, population, and infrastructure at risk.
That level of specificity changes how decisions get made. A utility that knows three specific circuits in its territory will carry elevated ignition risk on Thursday can pre-position crews, prioritize inspections on those circuits, notify affected customers, and make a more informed and defensible PSPS decision if conditions warrant it. A utility relying on a regional weather warning alone is making those same decisions with far less to stand on.
Turning Data into Actionable Intelligence
One of the practical challenges utilities face, particularly smaller ones, is aggregating multiple data streams into something their operations teams can actually use in a compressed decision window. Fuel moisture data, weather forecasts, fire spread simulations, asset risk ratings, and impact estimates all need to come together into a clear, current picture of where risk is concentrated and what the appropriate response is.
Leading utilities are consolidating this information into unified risk views, sometimes described as fire size potential maps or daily risk forecasts, that give operations teams a single point of reference for decision-making. The goal is not more data. It is faster, clearer answers to the questions that matter most: where is risk elevated today, which assets are most exposed, and what should we do about it.
This approach also supports longer-term planning. When a utility can see patterns in where risk concentrates across multiple forecast cycles and historical seasons, that data becomes the foundation for smarter vegetation management prioritization, more targeted asset hardening investments, and more credible wildfire mitigation plans submitted to regulators.
The Bottom Line
Every utility operating in wildfire-prone conditions, regardless of size or geography, needs to be able to answer a basic question: if one of our assets caused an ignition today, where would that fire go and what would it affect?
If the answer relies primarily on regional weather warnings, there is a gap worth closing. The technology and data to close it are accessible to utilities of all sizes. The utilities using it are not just better prepared for the next high-risk day. They are building a foundation for every operational and planning decision that follows.
-
Your Guide to Wildfire Risk and Liability Exposure
This webinar discusses understanding current trends in wildfire behavior and their implications on risk and liability exposure, along with methodologies for risk assessment, mitigation strategies, and tools for real-time monitoring and response to wildfire threats.
Duration: 1 hour
This informative webinar, in collaboration with Utility Dive, explores the tactics utilized by leading electric utilities to forecast, mitigate, and respond to wildfire risks and the associated liability.
As wildfires continue to increase in frequency and severity, they present a significant threat to electric utilities infrastructure and communities. Electric utilities face a risk stemming from their infrastructure to trigger wildfires and the liabilities that come with that.
Electric utilities can adopt proactive measures, such as preemptive power shutdowns to minimize the risk of wildfires and safeguard the areas in their service territory as well as using solutions that can help assess assets for mitigation purposes.
During the session, you will learn from Technosylva:
- Insights into the latest trends and patterns in wildfire behavior, and their implications for risk and liability exposure
- Methodologies for assessing wildfire risk and strategies for implementing effective mitigation measures
- Tools and techniques for real-time monitoring and response to wildfire threats
Speakers
David Buckley
Board Advisor
TechnosylvaScott Purdy
Meteorological Analyst
Technosylva -
Wildfire’s Wake-Up Call: Building a Culture of Proactive Risk Reduction

“The technical planning was solid, the legal framework was clear, but sitting in that boardroom, she realized the hardest challenge wasn’t operational: it was cultural.“
The regulator’s question cut straight to the heart of the matter: “So you’re asking us to approve a multimillion-dollar program designed to turn off our customers’ power? How exactly do we explain that to our stakeholders?” The CEO of ElectriCo knew the follow-up questions were coming: What about the customer complaints? How do we handle the public backlash when people lose power during heat waves?
The CEO had anticipated this moment. For months, her team had been developing their Public Safety Power Shutoff program, driven by regulatory pressure and mounting wildfire liability. But although the fire safety logic was sound, PSPS events also brought negative customer response: angry residents, frustrated businesses, and heated community meetings. The technical planning was solid, the legal framework was clear, but sitting in that boardroom, she realized the hardest challenge wasn’t operational: it was cultural.
At the same time, her veteran operations supervisor was grappling with the same challenge from a different angle. After 25 years of perfecting one skill above all others (getting the lights back on as fast as possible), he was now being asked to lead the new “proactive outage team.” Outage duration had been his scorecard, system reliability his measure of success. The irony wasn’t lost on him.
“Help me understand this,” he told his manager during their planning session. “We’re building teams to deliberately cause outages, and we’re calling this progress?”
For electric utility leaders facing growing wildfire threats, these parallel conversations in boardrooms and operations centers capture the essential challenge: transforming an organization built on reliable power delivery into one that embraces proactive power removal for community safety.
When Split-Second Decisions Meet Century-Old Culture
The first reality electric utilities face is that wildfire response operates on an entirely different timeline than traditional utility operations. When meteorological conditions shift rapidly, teams have 48 to 72 hours to analyze vast service territories, assess thousands of assets, and notify potentially tens of thousands of customers.
This creates an immediate tension. Electric utilities must maintain their core operational excellence while building entirely new capabilities that operate under completely different rules. Start here: give your wildfire response teams clear decision-making authority and direct executive reporting lines, separate from traditional operations approval processes.
Beyond 50/50 Calls: Understanding Your Risk Appetite
Perhaps the most challenging cultural shift involves how electric utilities approach uncertainty. Traditional utility planning often seeks to eliminate uncertainty through comprehensive analysis and conservative safety margins. Wildfire response requires utilities to make consequential decisions based on probabilistic forecasts and incomplete information.
This forces a critical organizational conversation: what is your utility’s risk tolerance? A conservative approach might cast a wider net during PSPS events, potentially impacting more customers to ensure comprehensive safety coverage. A higher risk tolerance might focus more narrowly on high-confidence risk zones, trading some uncertainty for reduced customer impacts.
The essential first step: document your risk tolerance explicitly and train teams to apply it consistently under pressure.
Building the Teams That Make It Work
The operational reality of wildfire response demands teams that bridge meteorology, operations, customer communications, and emergency management. These teams must be available 24/7 during high-risk periods and capable of making consequential decisions in compressed timeframes.
For all utilities, staff training becomes critical, focusing on interpreting meteorological data, understanding the fundamentals of fire behavior, and executing protocols under pressure. Most importantly: identify the specific wildfire expertise your teams lack, then find external partners who can provide not just technology, but cultural wisdom from utilities who’ve already made this transition. Executive engagement proves essential, signaling that this represents a fundamental evolution in how the utility serves its communities.
The Path Forward
The electric utilities successfully navigating this transition share common characteristics: they’ve built specialized teams with clear decision-making authority, invested in comprehensive staff training, and secured executive leadership that champions proactive risk management.
The cultural shift isn’t just about accepting PSPS or other necessary tools. It’s about building organizations capable of protecting communities through decisive action, even when that action challenges traditional utility instincts. For electric utilities still building this culture, the communities you serve are counting on your ability to evolve quickly and completely.
-
The Illusion of Prevention

Focusing solely on where and if a fire might start ignores the critical question of what happens when it does.
Electric utility risk managers nationwide are confronting an escalating challenge: the low probability, high consequence wildfire event.
While predicting ignition points is a crucial first step, there is a dangerous misconception that preventing ignitions equates to mitigating overall wildfire risk. Focusing solely on where and if a fire might start ignores the critical question of what happens when it does. This gap leaves electric utilities vulnerable to catastrophic outcomes, even with robust ignition prevention efforts.
It only takes one bad wildfire to change the entire future of a community and the utility that serves it.
As climate change fuels drought and increases energy demand, electric utilities in every state face mounting pressure to explain to their communities, creditors, and boards how they are mitigating wildfire risk and strengthening their reliability. This is no longer a problem of the West alone.
The Problem: Ignition Probability Is Not Actual Risk
A critical gap in many wildfire risk frameworks is equating ignition prediction with comprehensive risk assessment.
Ignition prediction is essentially the probability that an ignition will occur at a point, but risk is typically measured as probability of an event multiplied by the consequences of that event. Wildfire risk is not merely about the likelihood of a fire starting. It is about the magnitude of the potential consequences if one does.
A small fire in a remote, sparsely populated area poses a drastically different risk than a faster-spreading fire near a densely populated community or critical infrastructure. Focusing solely on ignition prediction fails to account for the potential for widespread damage, loss of life, and economic disruption.
This approach leads to a dangerous blind spot, where utilities may believe they have adequately mitigated risk by focusing on ignition prevention, while remaining exposed to the devastating consequences of a large-scale wildfire. Without understanding the potential consequence of a fire, prioritizing mitigation efforts becomes guesswork rather than a data-driven strategy.
The Challenge to Address
For this critical decision-making, electric utilities need to combine ignition probability with consequence analysis. This means:
Quantifying Impact: Consequence modeling quantifies the potential damage of a fire, including impacts on human life, property, and infrastructure. This data is essential for prioritizing mitigation efforts and targeting asset hardening under limited budgets and rate increase abilities.
Forecasting Fire Spread: Advanced fire spread modeling, integrated with weather forecasts, can predict the path and impact of a fire originating from a specific asset. This allows utilities to identify the most dangerous potential ignitions.
Understanding Asset-Specific Risk: Every asset has a unique ignition probability based on its condition, age, surrounding environment, and other factors. Electric utilities can analyze historical ignition data alongside potential fire spread models to understand the impact of a fire originating from each asset.
Prioritizing Hardening with Risk Spend Efficiency (RSE)
With limited resources, electric utilities need to maximize the impact of their mitigation investments.
Consequence-based risk modeling allows for the calculation of improved Risk Spend Efficiency (RSE). RSE measures the risk reduction achieved per dollar invested in hardening. By prioritizing assets with the highest RSE, utilities can achieve the greatest risk reduction for their budget.
The Bigger Picture: Moving from Planning to Operations
Safety and risk management are driving the adoption of consequence-based modeling, but the benefits extend beyond planning.
Understanding wildfire risk improves operational efficiency and informs critical decisions like Public Safety Power Shutoffs (PSPS) during an extreme weather event. As wildfire severity and frequency increase, this data-driven approach has become essential for all electric utilities.
Looking Ahead
The future of wildfire risk management for electric utilities depends on moving beyond the limited scope of ignition prediction.
By embracing consequence-based risk modeling, electric utilities can gain the critical insights needed to prioritize asset hardening, optimize mitigation strategies, and ultimately protect communities and infrastructure from the devastating impacts of wildfire. The widening of risk management from solely preventing fires to understanding and mitigating their potential consequences is no longer optional.
-
Building a Wildfire-Resilient Grid: A Long-Term Planning Approach

Grid hardening is not a project with a finish line. As fire weather patterns shift and service territory conditions change, the work of building a wildfire-resilient grid continues. For electric utilities, that means treating resilience not as a one-time capital program but as an ongoing planning discipline, one that requires regular reassessment, updated data, and a clear method for deciding where investment will produce the most meaningful risk reduction.
Start with a Strong Data Foundation
For utilities earlier in this process, the starting point is data. Understanding wildfire risk at the asset level requires integrating multiple inputs: historical fire weather, fuel conditions, terrain, vegetation, and the physical attributes of the infrastructure itself. Without a consistent data foundation, prioritization decisions rest on incomplete information and risk being driven by the most visible consequences rather than the actual distribution of risk across the system.
Building that foundation does not require solving everything at once. Utilities of any size can begin by identifying what data they have, where the gaps are, and what decisions are currently being made without adequate information. That assessment shapes the path forward.
Use Modeling to Prioritize at the Asset Level
Once a data foundation is in place, the next step is applying it. Engineers analyzing circuits for hardening and rebuilding projects need more than general hazard zone designations. They need to understand which specific assets carry the highest expected risk and what mitigation measures will produce the greatest reduction per dollar invested.
In a Utility Dive article, Vanderburg explained that by combining historical fire weather scenarios with advanced wildfire spread modeling, utilities can calculate potential impacts at the individual asset level. That analysis surfaces which circuits are most exposed, how past fire weather would have interacted with current infrastructure, and where hardening investment is likely to yield the most return. It also reveals where prior investments have already reduced risk substantially, so that new dollars are not directed toward assets where diminishing returns have already set in.
This kind of asset-level modeling is what separates a defensible capital prioritization from one based primarily on consequence footprint or geographic proximity to recent fires.
Integrate Real-Time Conditions with Long-Term Planning
Long-term planning and operational awareness are not separate activities. Risk managers who integrate fire spread prediction with forecasted weather data develop a clearer picture of where ignition risk is highest across their service territory at any given time. That situational awareness informs not just day-to-day operations but longer-term decisions about where to focus vegetation management and where to accelerate hardening timelines.
When planning and operations share the same underlying risk picture, investment decisions are easier to defend and easier to adjust as conditions evolve.
Plan for Adaptation, Not Just Completion
One of the more common planning errors is treating a hardening program as complete once a set of projects is finished. Grid conditions change. Vegetation grows back. Equipment ages. Fire weather shifts. A resilience strategy that does not build in regular reassessment will gradually fall out of alignment with actual risk.
Building adaptation into the planning cycle means scheduling periodic risk reassessments, tracking how mitigation investments have changed the risk profile of the system, and being willing to reprioritize when the data supports it. It also means maintaining the organizational capacity to do that work: staff who understand wildfire risk modeling, can interpret the outputs, and can connect them to capital planning decisions.
A Continuous Investment, Not a One-Time Fix
The utilities making the most progress on wildfire resilience are the ones that have moved past the question of whether to invest and into the harder question of how to invest most effectively. That shift requires reliable data, asset-level modeling, and a planning process that treats risk reassessment as a regular input rather than an occasional project.
The goal is not a perfect grid. It is a planning approach that consistently directs investment toward the assets and strategies most likely to reduce risk for communities, the environment, and the system as a whole.
This article is adapted from a piece originally published in Utility Dive.
-
Why Consequence Modeling Belongs at the Center of Asset Hardening Decisions

Simply knowing that an asset could ignite a wildfire is not enough to make a sound hardening decision. Ignition probability tells you where a fire might start. It does not tell you what happens next, or how bad it could get. That distinction matters significantly when hardening budgets are finite and prioritization decisions have real consequences for communities and infrastructure.
As Buckley outlined in a Utility Dive article, ignition is not risk. Risk is the possibility of damage, loss, and harm occurring from an ignition. Two assets with similar ignition probabilities can produce very different outcomes depending on what lies in the potential fire’s path. Understanding that difference is what makes consequence modeling a planning tool, not just an analytical one.
Why Not All Ignitions Are Created Equal
All utility assets carry some probability of failure and ignition. That probability varies based on asset condition, age, design, conductor type, surrounding vegetation, slope, and local weather patterns. But even assets with identical ignition probabilities can pose very different levels of risk depending on where they sit and what a fire starting there would affect.
Consequence modeling addresses this by integrating fire spread prediction with forecasted weather to determine where a fire would travel from a specific asset ignition point and what it would impact along the way. The outputs, structures threatened, population exposed, acreage burned, give planners a concrete basis for comparing assets that ignition probability alone cannot provide.
Not all ignitions are created equal. Not all fires are created equal. Consequence modeling is what makes those differences visible and actionable.
Using Consequence Data to Prioritize Hardening
Once consequence is understood at the asset level, it can be combined with ignition probability to calculate expected risk, the foundational metric for defensible hardening prioritization. But consequence modeling also supports a longer-term planning view that goes beyond a single season or event.
By leveraging weather and landscape data over ten or more years, utilities can identify which assets have been consistently associated with the highest potential consequences from ignition across a range of historical conditions. That longitudinal view separates assets that appear risky in one bad season from those that carry genuine long-term exposure. It is the latter that warrant priority hardening investment.
With consequence data grounding the analysis, any hardening decision can be assigned a quantifiable risk reduction. When that reduction is divided by the cost of the mitigation, the result is a risk spend efficiency (RSE) figure. RSE analysis allows utilities to compare hardening options across their asset portfolio and direct limited resources toward the investments that will reduce overall system risk most effectively per dollar spent.
Regulatory Context and Planning Implications
California’s Public Utility Commission regulations have brought consequence modeling and RSE analysis into formal wildfire mitigation planning requirements for utilities in that state. But the planning value of this approach extends well beyond California. Wildfire-related regulation is expanding in scope and complexity across other states, and the underlying logic, that utilities need to demonstrate not just what they did but why they prioritized it, applies regardless of the specific regulatory framework in place.
On the operational side, consequence data also informs Public Safety Power Shutoff (PSPS) decision-making. Knowing which assets pose the highest expected consequence under forecast conditions gives operators a more defensible basis for de-energization decisions than ignition probability alone.
A More Complete Basis for Investment Decisions
Consequence modeling does not replace engineering judgment or operational expertise. It gives planners and risk managers the information needed to make hardening decisions that are grounded in expected impact rather than visible hazard alone. For utilities building or refining their wildfire mitigation programs, integrating consequence modeling into the prioritization process is what moves asset hardening from reactive to systematic.
This article draws on analysis originally published in Utility Dive by David Buckley, former COO of Technosylva.
-
A First Time Validation of Fire Spread Modeling on the Fire Line
Despite California being a major fire hotspot in the Americas, there is no extensive scientific analysis of operational fire spread models allowing analysis of their performance and drivers leading to model inaccuracies. Recent advances in technology have allowed monitoring the fire progression of most wildfires every 15 min in the United States through the National Fireguard Detections platform. This data, when available for use on a fire, provides unprecedented capabilities to analyze factors influencing fire behavior and compare the observed and predicted wildfire rate-of-spread (ROS) modeling in fires distributed across different and complex landscapes.
Building on other studies that analyzed these modeling techniques, Technosylva joined with CALFIRE and led a 2023 peer-reviewed study, published in the International Journal of Wildland Fire that assesses the performance of fire spread models used in California by comparing observed fire growth data with simulated data. The analysis reviewed operational settings under different environmental conditions using 1853 California wildfires from 2019 to 2021 to determine what conditions the current models may over, or underestimate ROS and subsequently, the burned area and associated fire impacts on buildings and other assets.
“It was a great opportunity to analyze these fires because it’s the first time we have had such a data set with its huge number of files and additionally, temporal resolution of that data in polygons every 15 minutes. So, it is unprecedented to have both this amount of fire monitoring data and a fire behavior simulator platform with high-quality inputs, including the fuel types, the weather conditions, canopy characteristics, and other pieces.
The analysis allowed us the opportunity to compare the best fire modeling possible with the best fire monitoring possible. The main conclusion from the analysis was that these models can be used in wildfire operational environments.”

Adrián Cardil, Ph. D
Lead Author & Senior Fire Researcher
Insight from the Research
Wildfire spread models play a crucial role in predicting how fires propagate, but their accuracy is influenced by various factors, including fuel availability, topography, and weather. Among these models, Rothermel’s semi-empirical model has been widely used for its simplicity and computational efficiency. However, the inherent limitations and assumptions of these models, along with input data quality, can impact their reliability.
This study, conducted in California, aimed to assess the predictive accuracy of wildfire spread models under different environmental conditions. It utilized high-resolution data from the National Fireguard Detections product to compare observed and predicted Rates of Spread (ROS) for 1853 wildfires occurring from 2019 to 2021. The analysis sought to identify conditions under which the models overestimate or underestimate ROS, ultimately affecting the burned area and fire impacts on buildings and assets.

Cite: Adrián Cardil Key observations and findings from the Research
- Fire Progression Data: The study used the National Fireguard Detections product data, offering high temporal resolution to monitor fire progression every 15 minutes. A grid-growing clustering algorithm was employed to classify polygons into individual fire incidents, enabling a quantitative analysis of fire behavior.
- Fire Modeling with WFA-e: Fire simulations were conducted using WFA-e, incorporating various fire spread models, including Rothermel’s surface and crown fire spread models. Fuel type, topography, and weather data were integrated to run simulations.
- Statistical Analysis: The accuracy of the fire spread models was assessed using error metrics such as ROS residuals, mean absolute error (MAE), mean bias error (MBE), and mean absolute percentage error (MAPE).
- Environmental Factors: The study revealed that the accuracy of fire spread predictions was influenced by environmental variables such as wind speed and fuel moisture content (both live and dead). Low wind speeds and high fuel moisture levels tended to lead to underestimations of ROS, while high wind speeds resulted in overestimations.
- Fuel Types: Different fuel types played a significant role in the accuracy of predictions. Models performed relatively well for shrub, grass, and grass-shrub fuel types, while they consistently underpredicted ROS for timber fuel types.
- Overall Model Accuracy: The models had an average MAPE of 47% for automatic fire simulations, with better performance in shrub, grass, and grass-shrub fuel types. Timber fuel types exhibited the highest MAPE (approximately 67%).
The study found that the model errors and biases were reasonable for simulations performed automatically. It identified environmental variables that might bias ROS predictions, particularly in timber areas where some fuel models might underestimate ROS. Overall, the performance of fire spread models for California aligns with studies developed in other regions, and the models are deemed accurate enough to be used in real-time to assess initial attack fires.
Next Steps from the Research
The study highlighted challenges related to pyroconvection, local wind fields, and the estimation of ROS in timber areas. It recommended the development of improved fire spread models to address these challenges and enhance prediction accuracy.
The study found that while current fire spread models have limitations and biases, they are accurate enough to be used in real-time operational settings, particularly with the capability for manual adjustments and calibration. However, there is a need for ongoing improvements, especially for modeling fire spread in timber areas, predicting crown fire behavior, and considering the effects of pyroconvection. This research contributes valuable insights to wildfire prediction and management, emphasizing the importance of continuously refining and enhancing predictive models in the face of growing wildfire threats.
The research underscores the importance of wildfire simulators in supporting planning and incident analysis in real-time, despite the potential uncertainties derived from input data quality and model inaccuracies. The study additionally provides insights into the performance of fire spread models in California, offering a foundation for understanding and potentially improving upon current operational models in the future.