Article
Is Your Weather Model Designed for the Decisions You Actually Make?
By Brent Shaw, Sr. Director, Numerical Weather Systems
Utility operators don’t make decisions about weather. They make decisions about their systems — crew staging, customer notifications, protective settings — under weather conditions that are constantly evolving, making the forecast a critical input. Understanding the uncertainty around a forecast and how to interpret different data sources is critical for utility operations. But, those forecasts stop short of information you can act on since they don’t reflect how your system performs during extreme events.
Not All Weather Models are Solving the Same Problem
When people describe one weather model as “better” or “more accurate” than another, they’re usually oversimplifying how forecast quality actually works. Meteorologists evaluate forecasts using a concept called skill: how much a forecast improves over a baseline reference like climatological averages or persistence. A forecast can score well on standard accuracy metrics while offering little operational value for a specific use case, or it can show moderate accuracy in the aggregate while being exceptionally skillful at detecting the conditions that matter most.
This distinction is not academic. All numerical weather prediction models carry biases. All of them involve tradeoffs — resolution, computational cost, processing speed, coverage area. The operationally meaningful question is whether a model is skillful at the specific task it’s designed to support.
Our weather modeling is built on the Weather Research and Forecasting model, or WRF — the same open-source, community-developed system used by the National Weather Service for regional high-resolution modeling (the HRRR being one of the most popular), as well as by thousands of other users spanning international governments, research institutions, and private companies.
Running WRF is not, by itself, unique. What differentiates one implementation from another is how it’s configured, what it’s validated against, and what decisions it’s built to inform. We run WRF at 2 km resolution across the entire US, producing four forecast cycles per day extending five days out. That configuration is optimized to identify the extreme weather conditions that drive consequential utility decisions. Fire was the original catalyst — humidity, wind gusts, and precipitation are among the most critical drivers of fire behavior. But those same variables also govern the severity of convective storms, derechos, ice events, and the cascading failures that utilities face across every season.
A five-day forecast calling for 80 mph gusts tells an operator very little without context. Eighty miles per hour in the mountain passes of Southern California or on top of Mount Washington is a regular occurrence, but in central Georgia, those same winds may be cause for serious concern for the local distribution system’s ability to withstand impact. The same numbers carry fundamentally different operational weight depending on location. Our 20-year historical reanalysis runs at the same 2 km with identical physical options and reconstructs past weather using a consistent model configuration so that every forecast grid cell can be expressed as a percentile of the historical climatology for that specific location. Running this kind of high-resolution reanalysis requires significant, dedicated computing infrastructure and weather modeling expertise, enabling a climatology model that clearly helps operators understand when conditions are truly unusual for their territory.
The Resolution Mismatch You May Not See
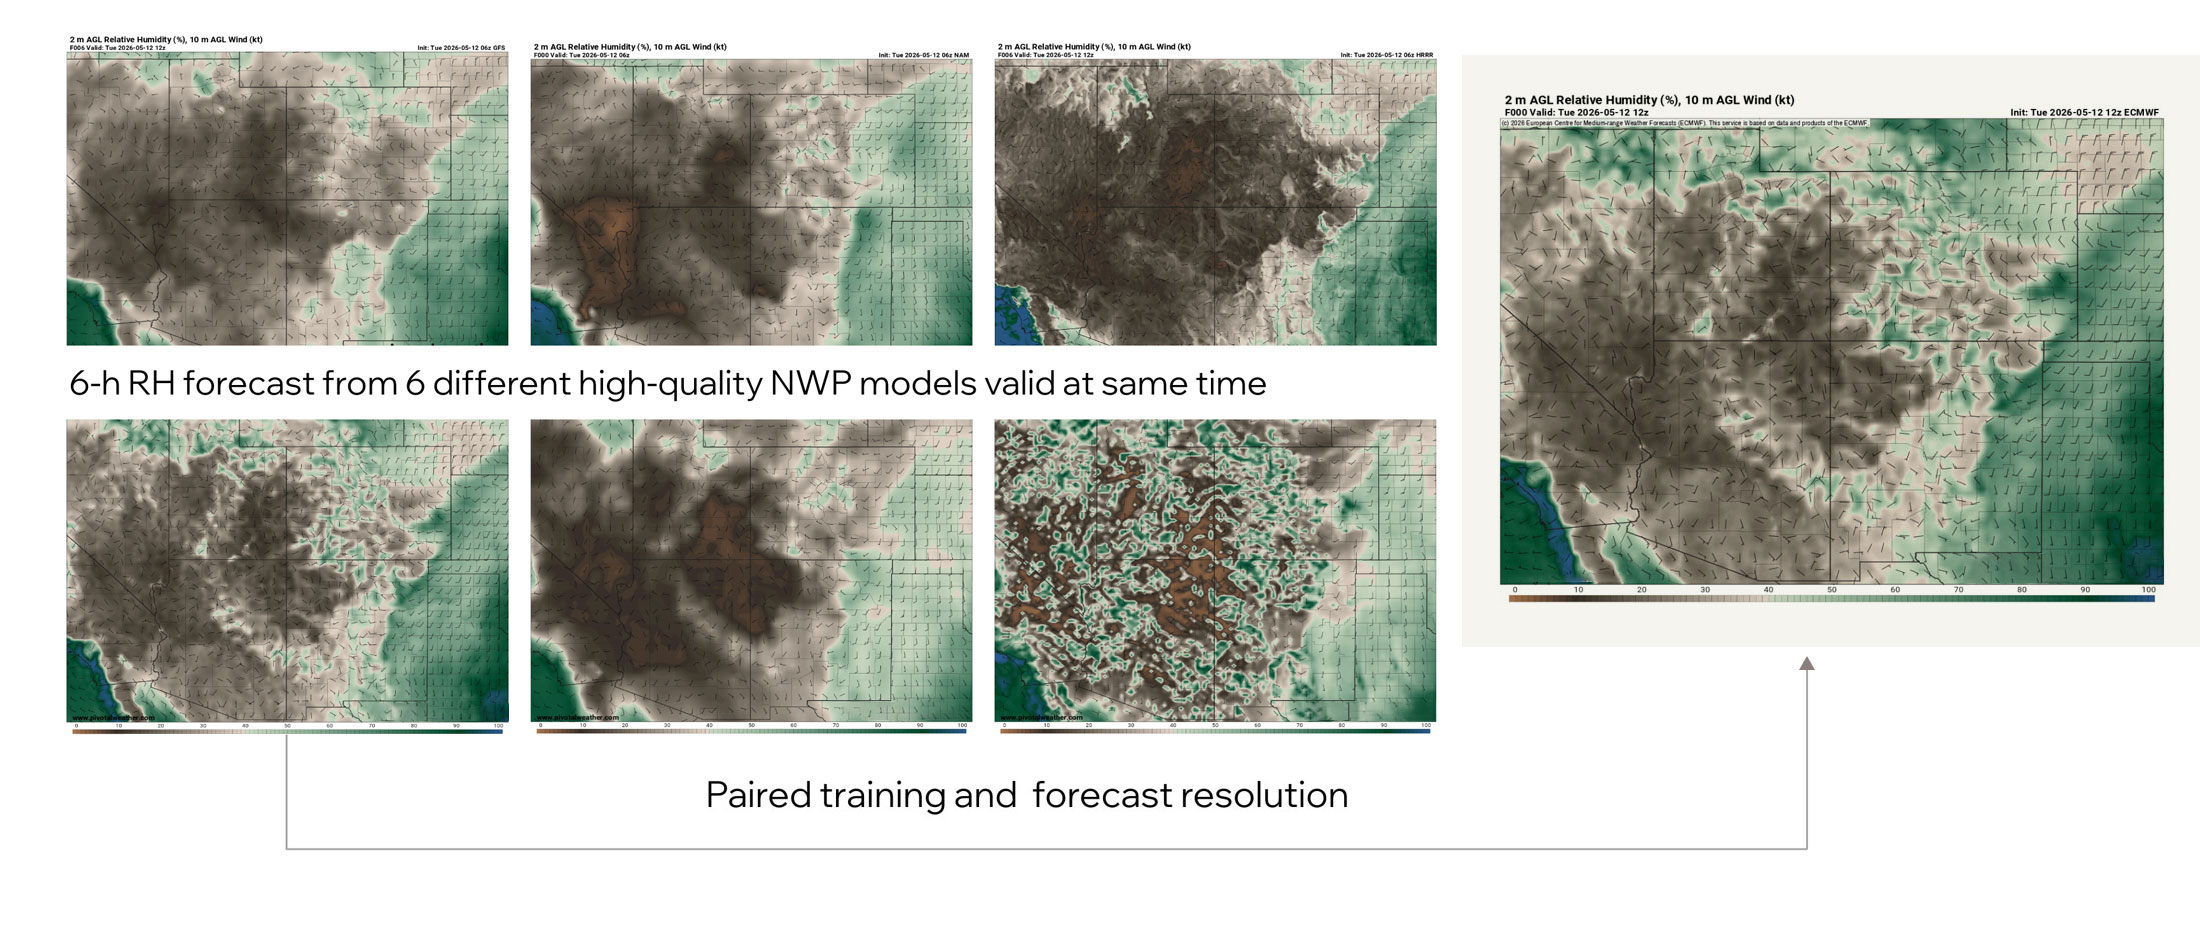
Many approaches train predictive models using one weather dataset and then generate forecasts at a different resolution. The mismatch compounds errors in ways that are not always visible downstream.
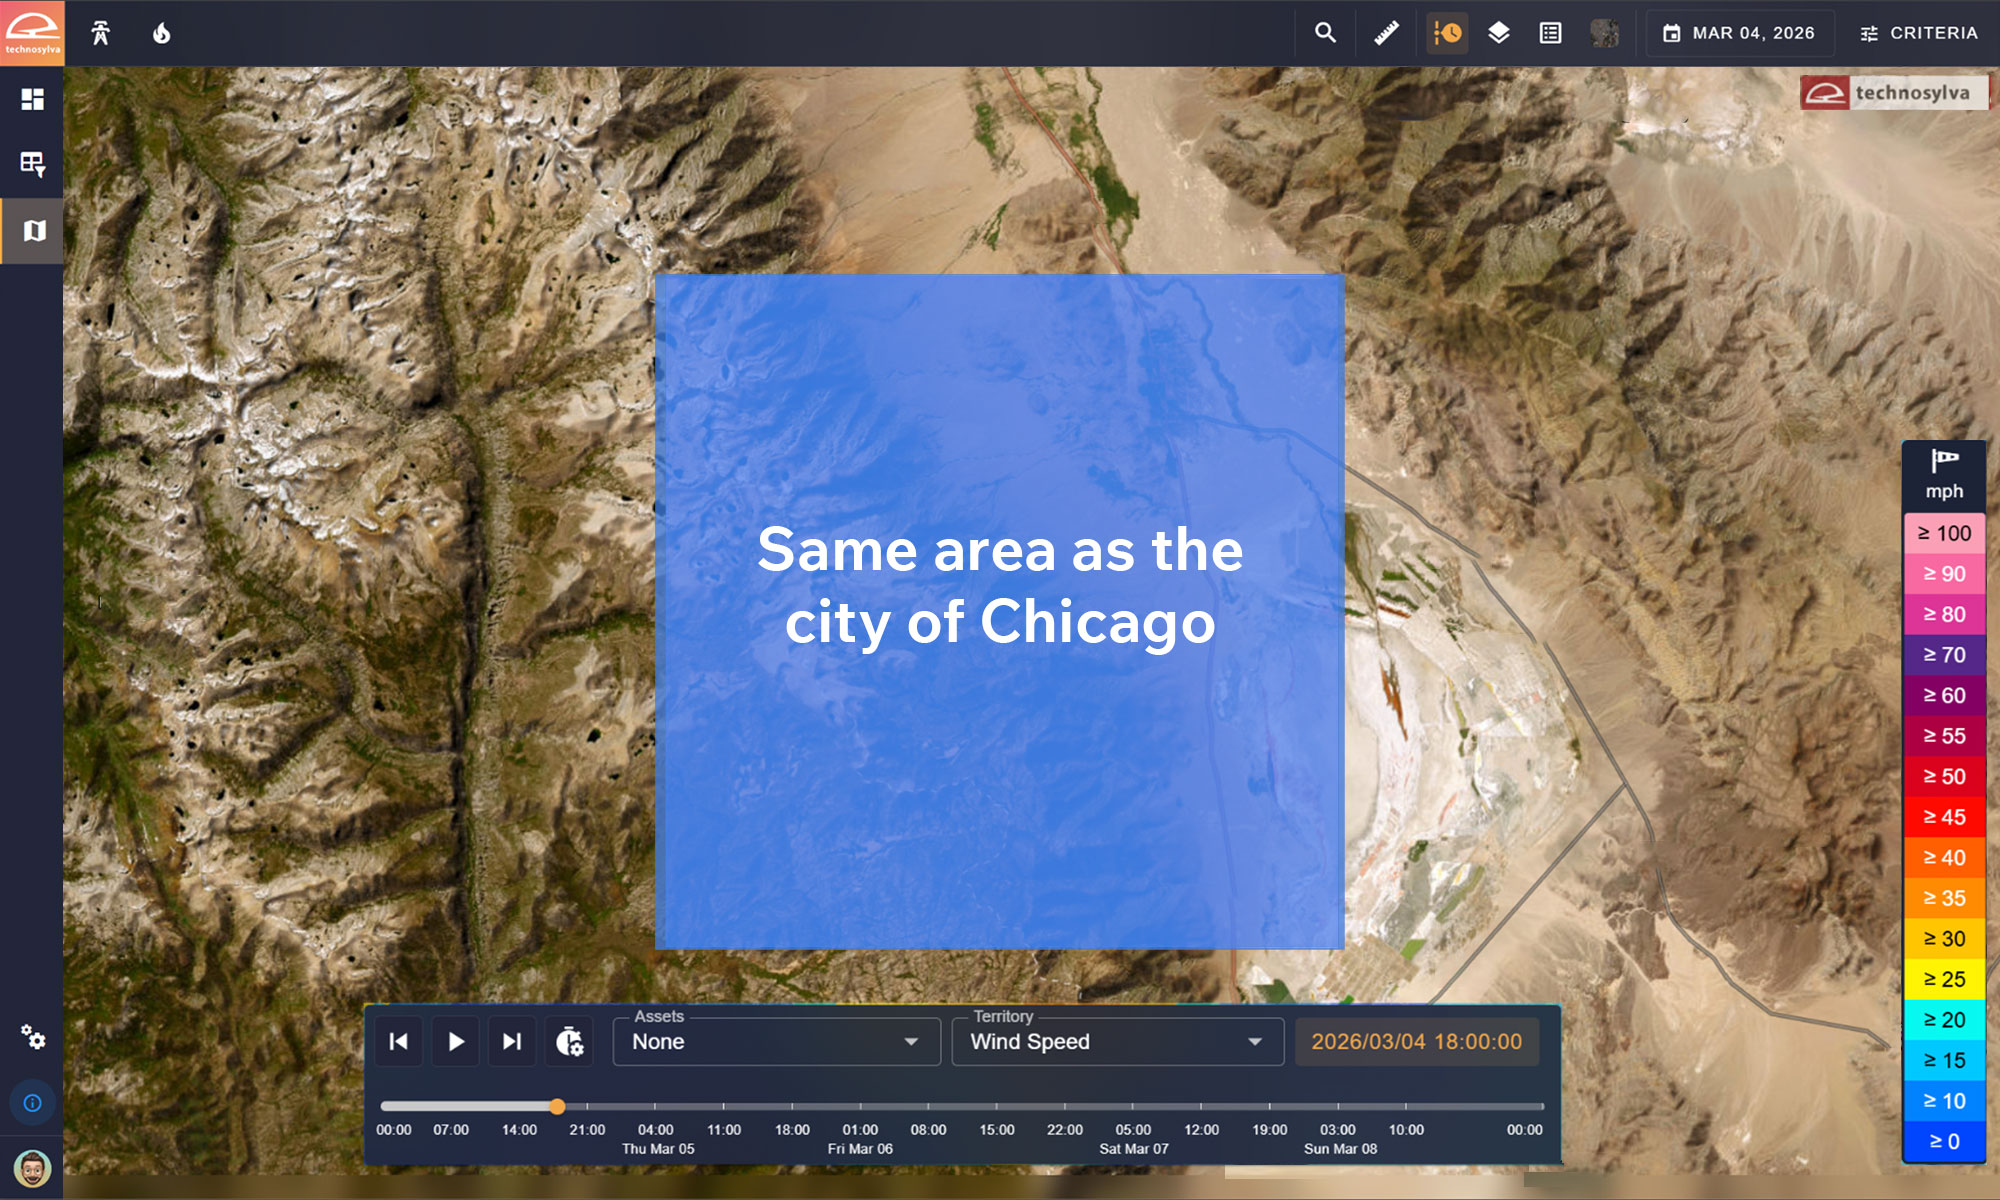
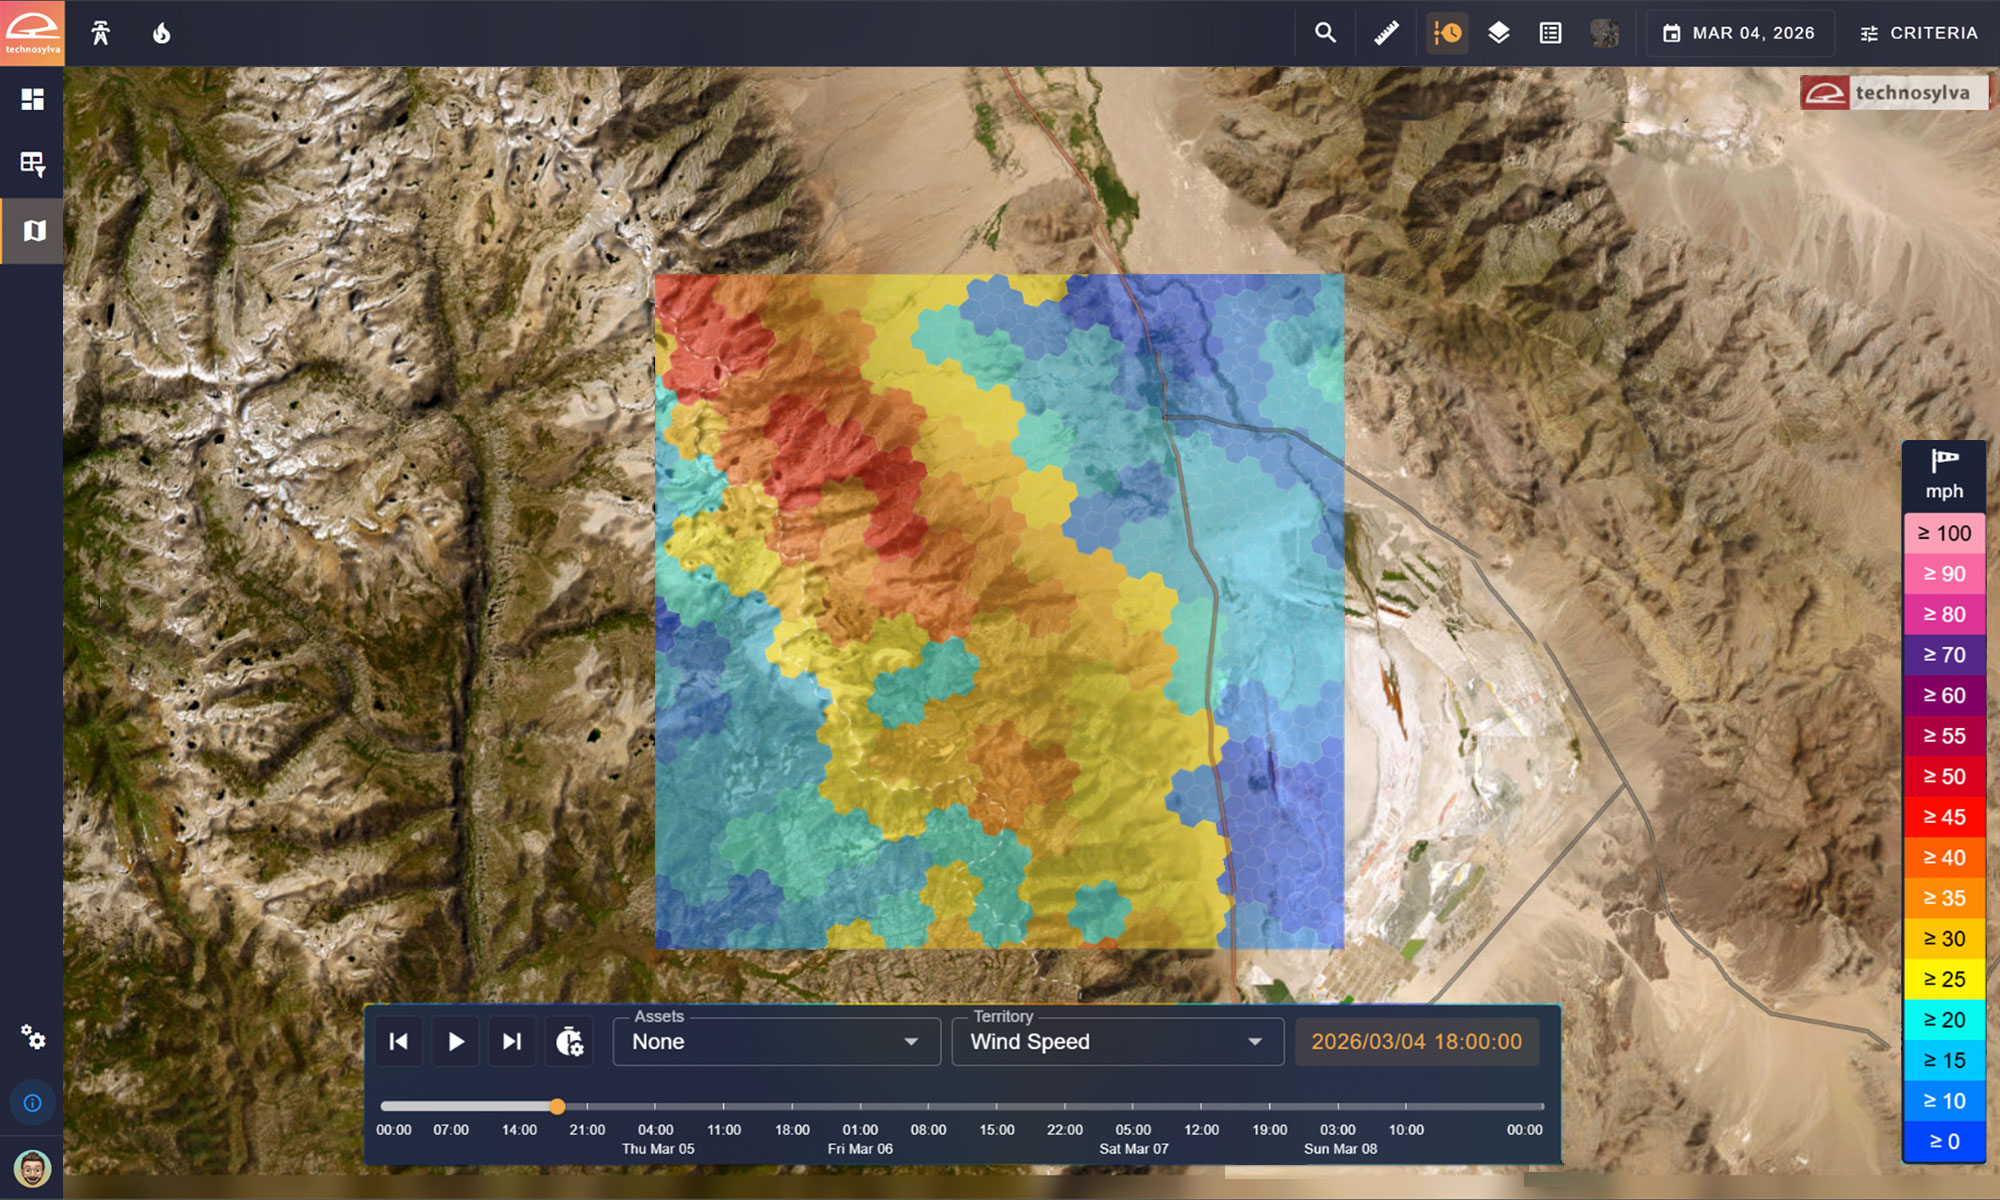
Consider ERA5, a widely used public weather model at roughly 31 km resolution. A single ERA5 grid cell covers approximately the area of the city of Chicago. Using that 31 km box to characterize wind conditions at the asset level misses microclimatic differences – it’s not the same wind speed throughout the entire City of Chicago. Inside that same footprint, a 2 km grid provides 240 distinct data points.
—
A single ERA5 grid cell covers an area roughly the size of Chicago. Drag the slider on the right to reveal the local wind variability hidden within that area.
Our approach pairs the operational forecast and the historical reanalysis at the same resolution and configuration, resulting in a true apples-to-apples comparison and minimizing the distortions that arise when comparing a high-resolution forecast to a global model. That consistency shows up in the downstream analytics that drive operational decisions: proprietary fire danger metrics, wind gust percentiles calibrated to each utility’s service territory, and outage predictions that reflect actual local variability.
Purpose-Built Modeling
None of this is about building a weather model that outperforms the National Weather Service, which serves a broad, critical public mission, in general-purpose forecasting. The operational need for utilities is different: weather intelligence optimized to flag the conditions under which grid assets are most vulnerable, with enough historical depth to distinguish routine from extreme, and enough spatial precision to identify the areas most likely to experience problems.
The question worth asking about any weather model powering utility operations is not whether it is “more accurate.” It is whether it was designed, configured, and validated for the decisions operators actually face when conditions deteriorate.
For additional information on extreme weather risks and preparedness, visit our Extreme Weather page.