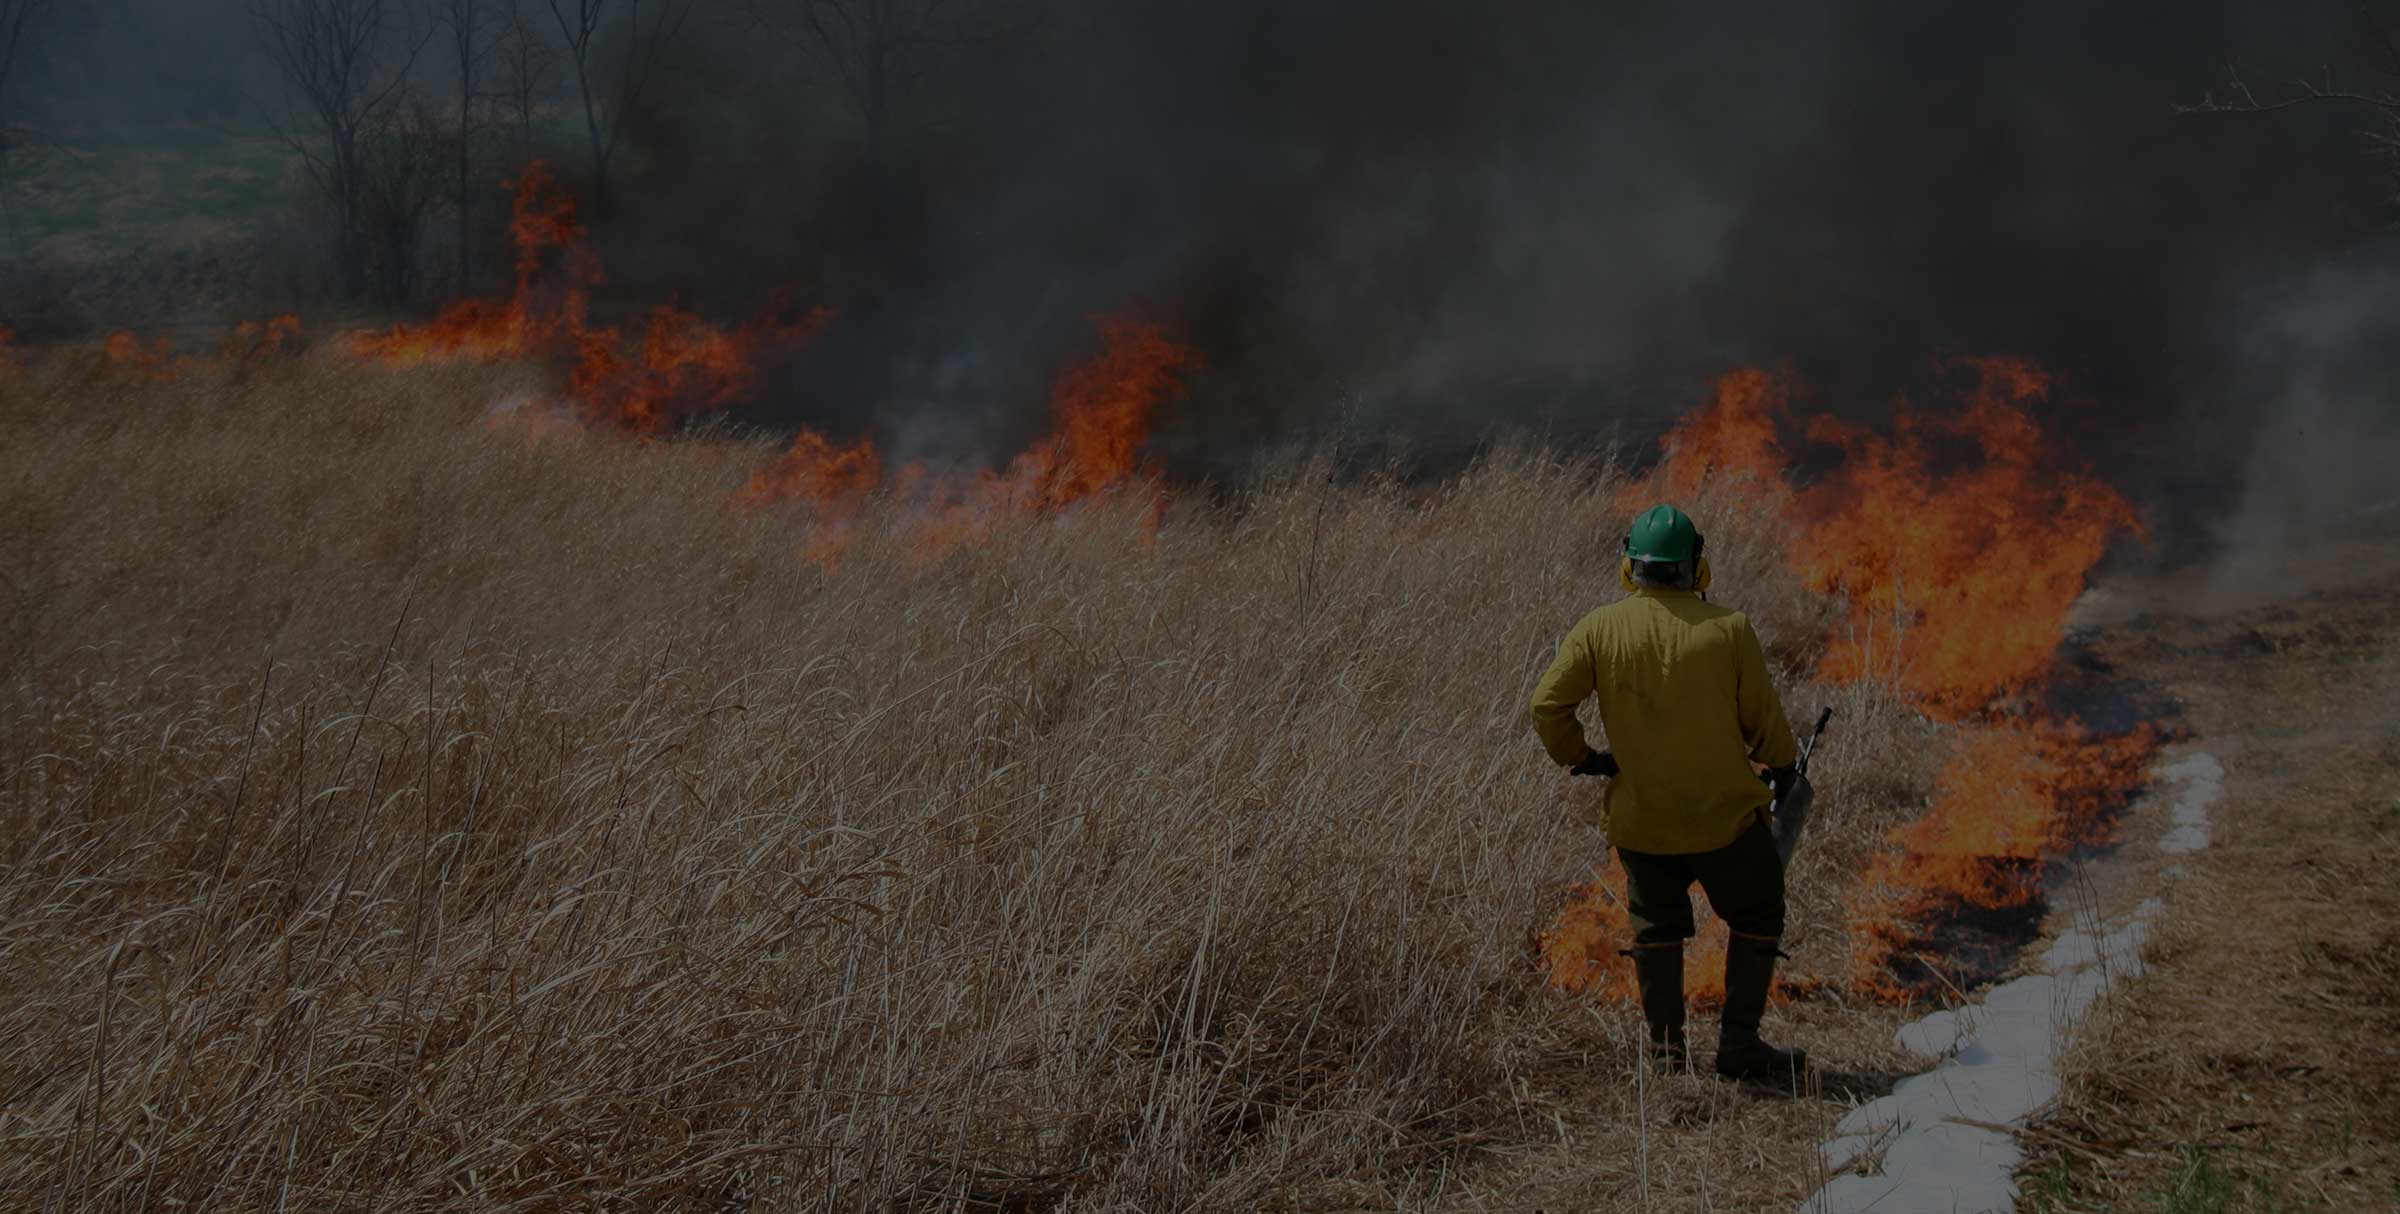
FIRE SCIENCE
Proven where it matters.
All of Technosylva’s wildfire solutions are grounded in decades of expertise in fire behavior modeling, weather science, and AI—integrated to help utilities and fire agencies make surgical, informed decisions. This depth of expertise in wildfire modeling is what enables more accurate, real-world predictions at scale.
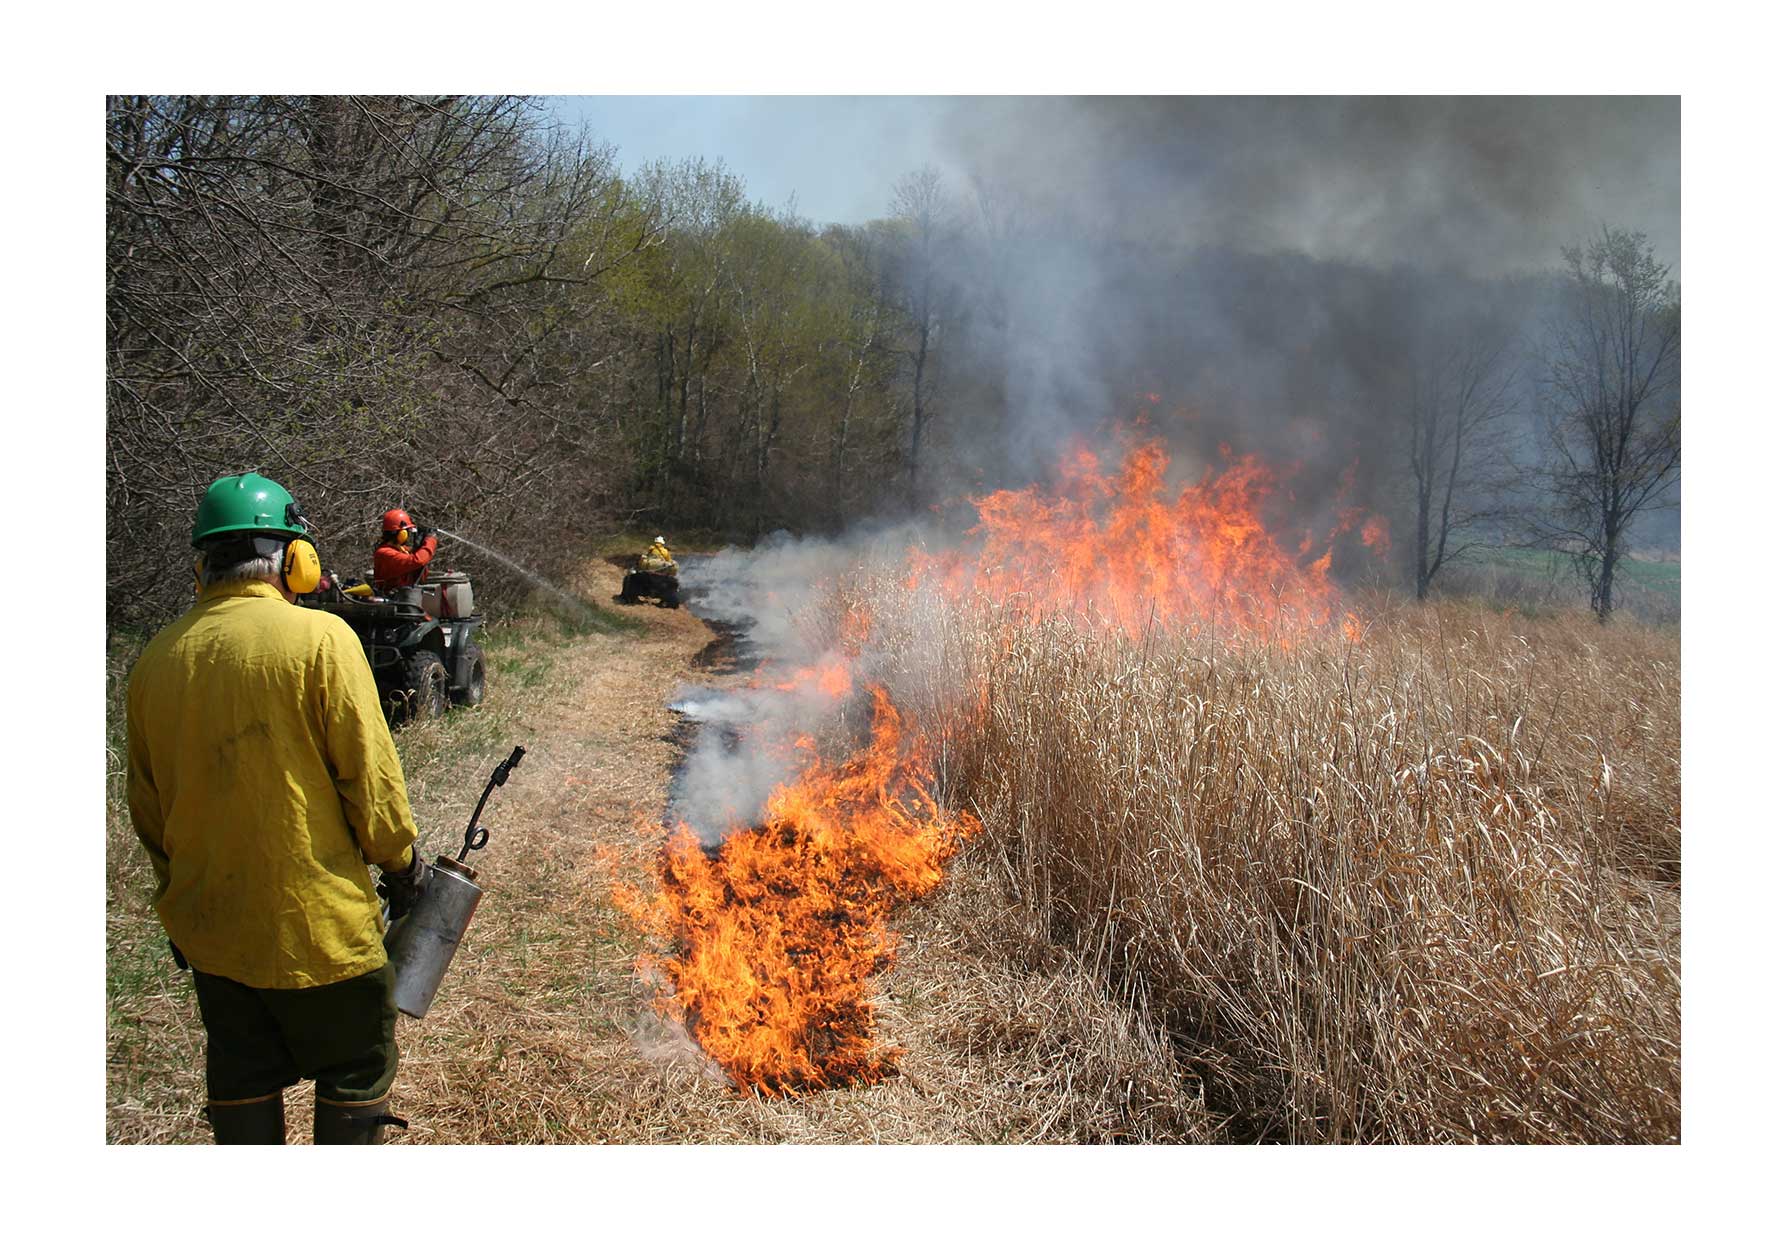
Scientific and operational validation.
In addition to scientific verification by other wildfire scientists, Technosylva’s wildfire modeling is also proven operationally by fire agencies and utilities working in areas with some of the highest levels of fire danger, giving teams the confidence to act in real-world conditions.
> 500,000
Technosylva’s models have been validated at-scale based on over > 500,00 historical fires. This is hundreds of times more fires than the foundational Rothermel model.
30,000
Our models are battle tested in the field and used by fire agencies and utilities to support more than 30k incidents every year.
85%
Our predictions are honed for precision, with 85% accuracy of building losses for historical fires in wildland urban interface (WUI) environments.
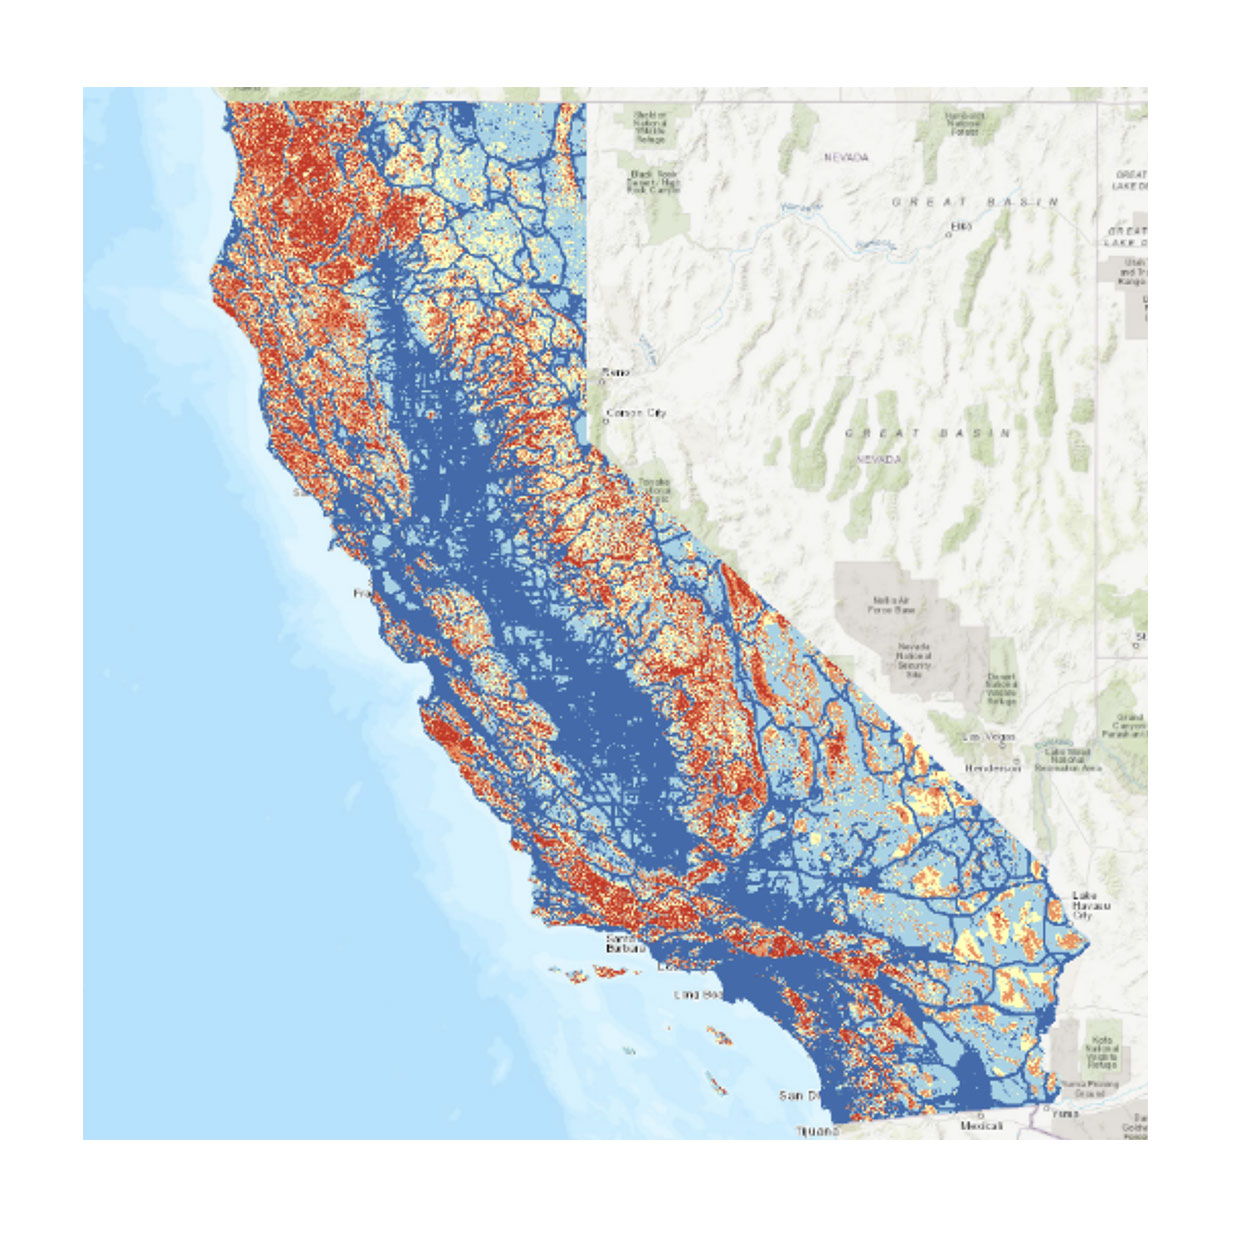
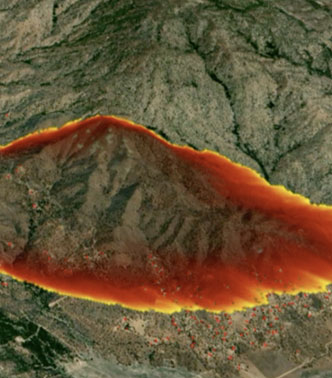
Advanced science focused on the core drivers of fire risk and behavior.
Fire behavior is influenced by a confluence of variables within weather, fuels, and topography. Technosylva’s innovation lies in enhancing the accuracy and precision of these components, and knowing how their interaction drives fire behavior. This allows teams to anticipate how fires will spread and what mitigations to take.
WEATHER
Pressures from the atmosphere
Wind, humidity, temp, and precip can all impact fire behavior, danger, and risk conditions, rate of spread and intensity can all impact fire behavior, danger, and risk conditions.
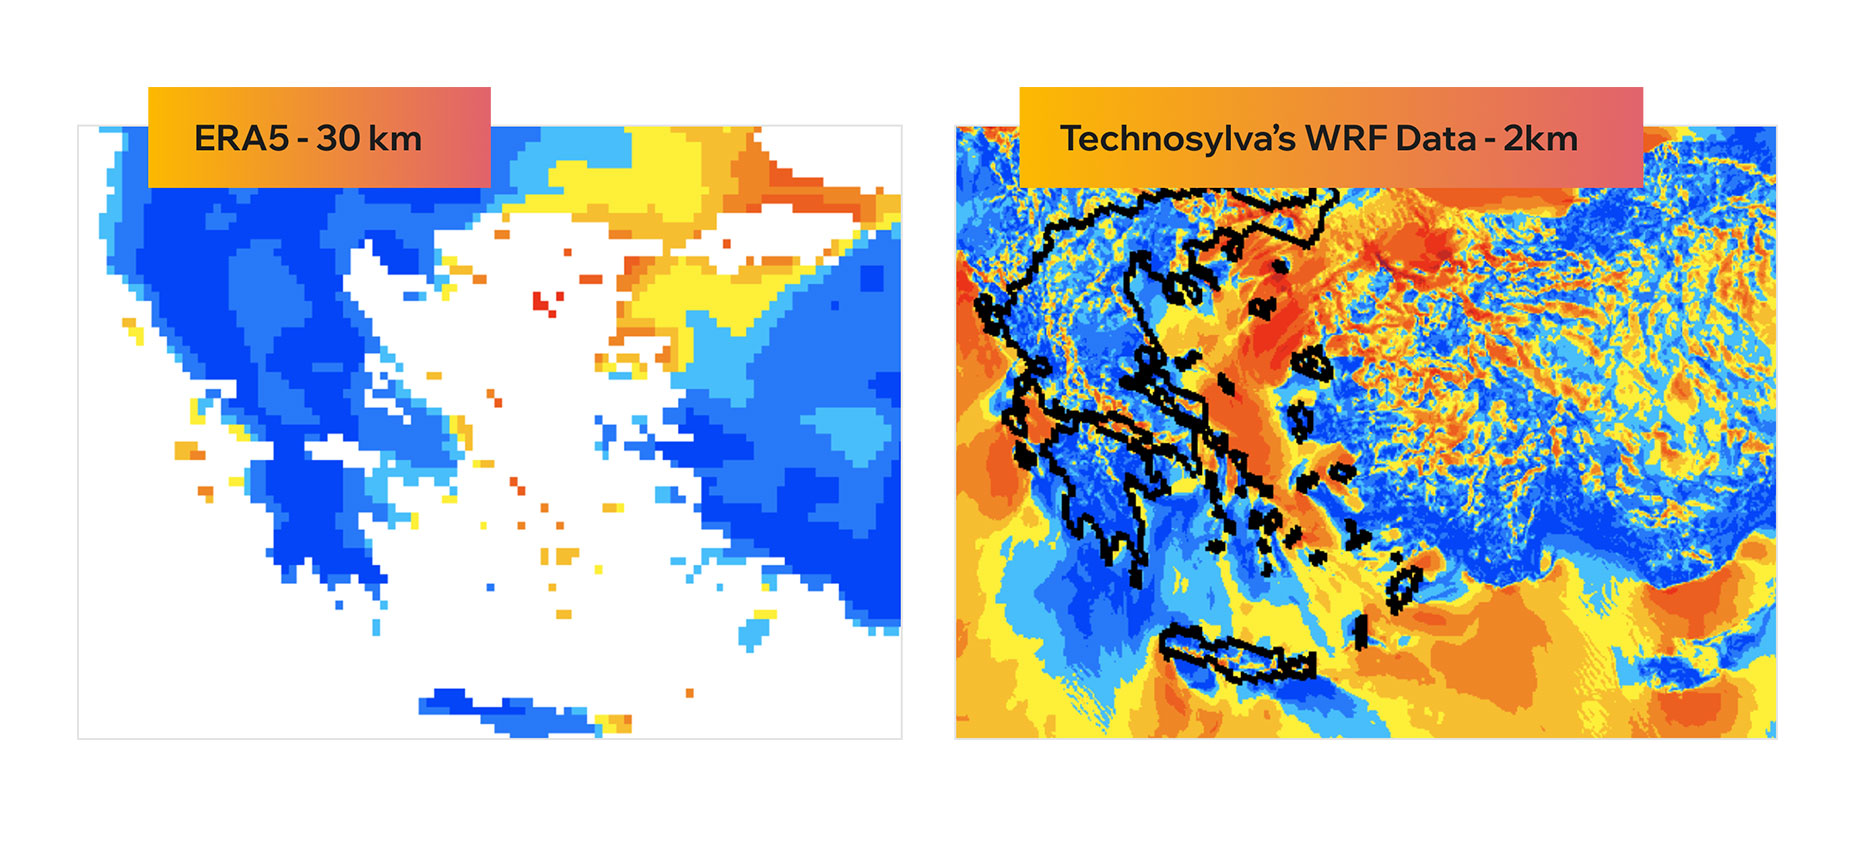
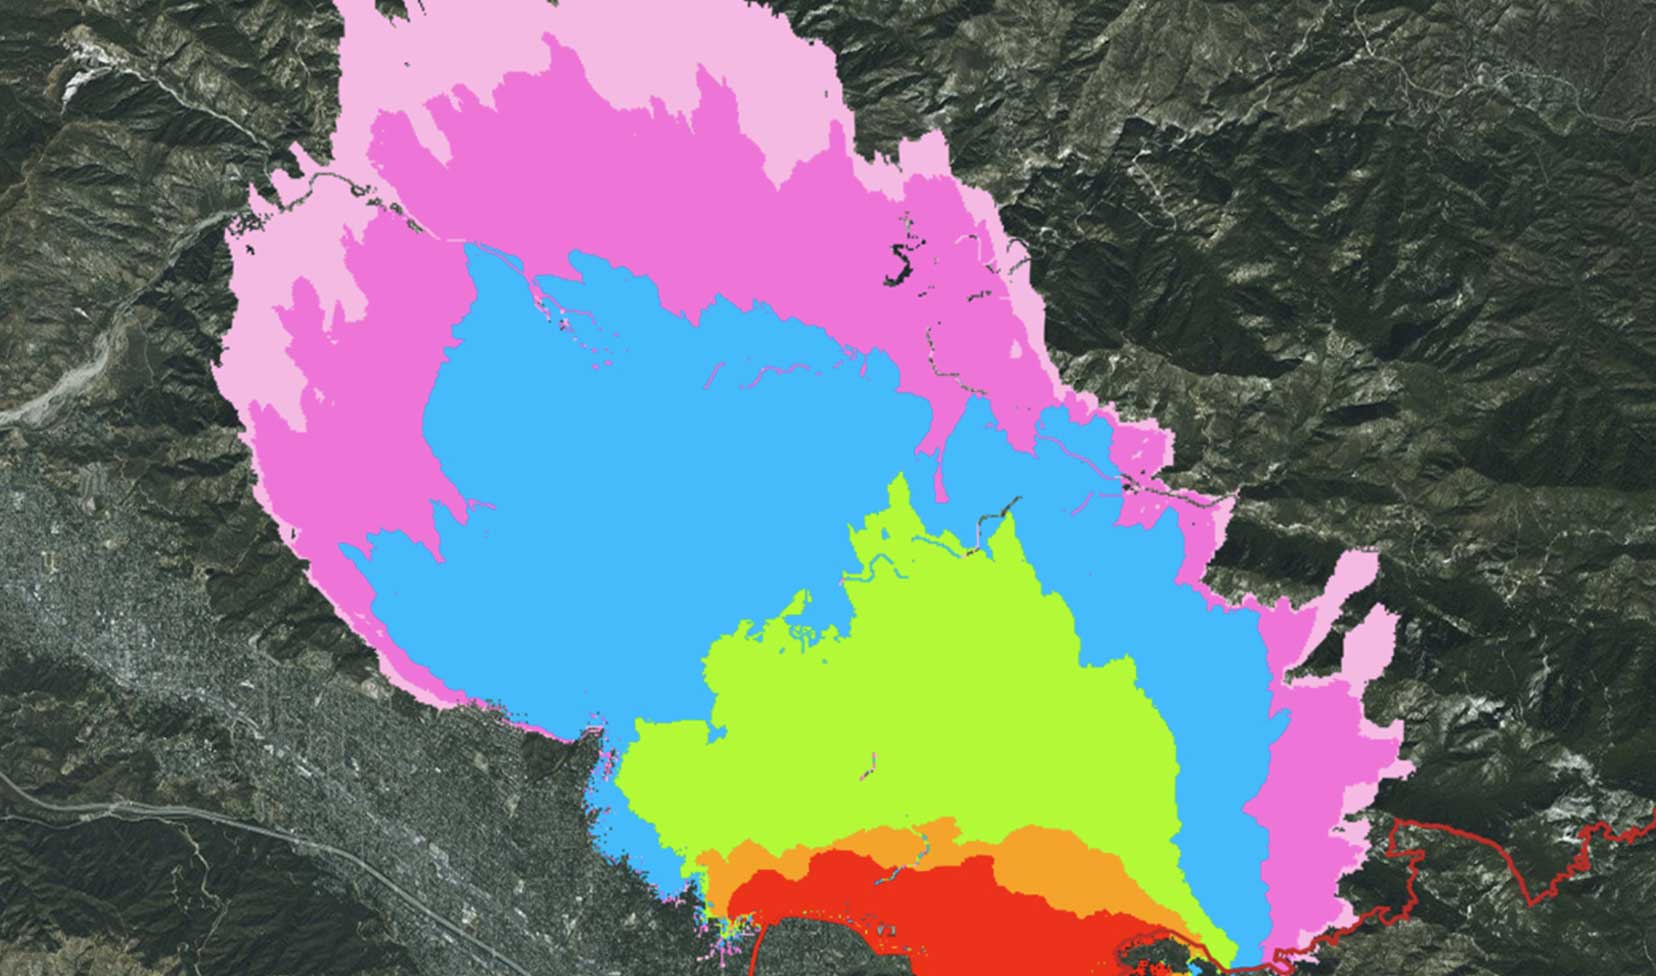
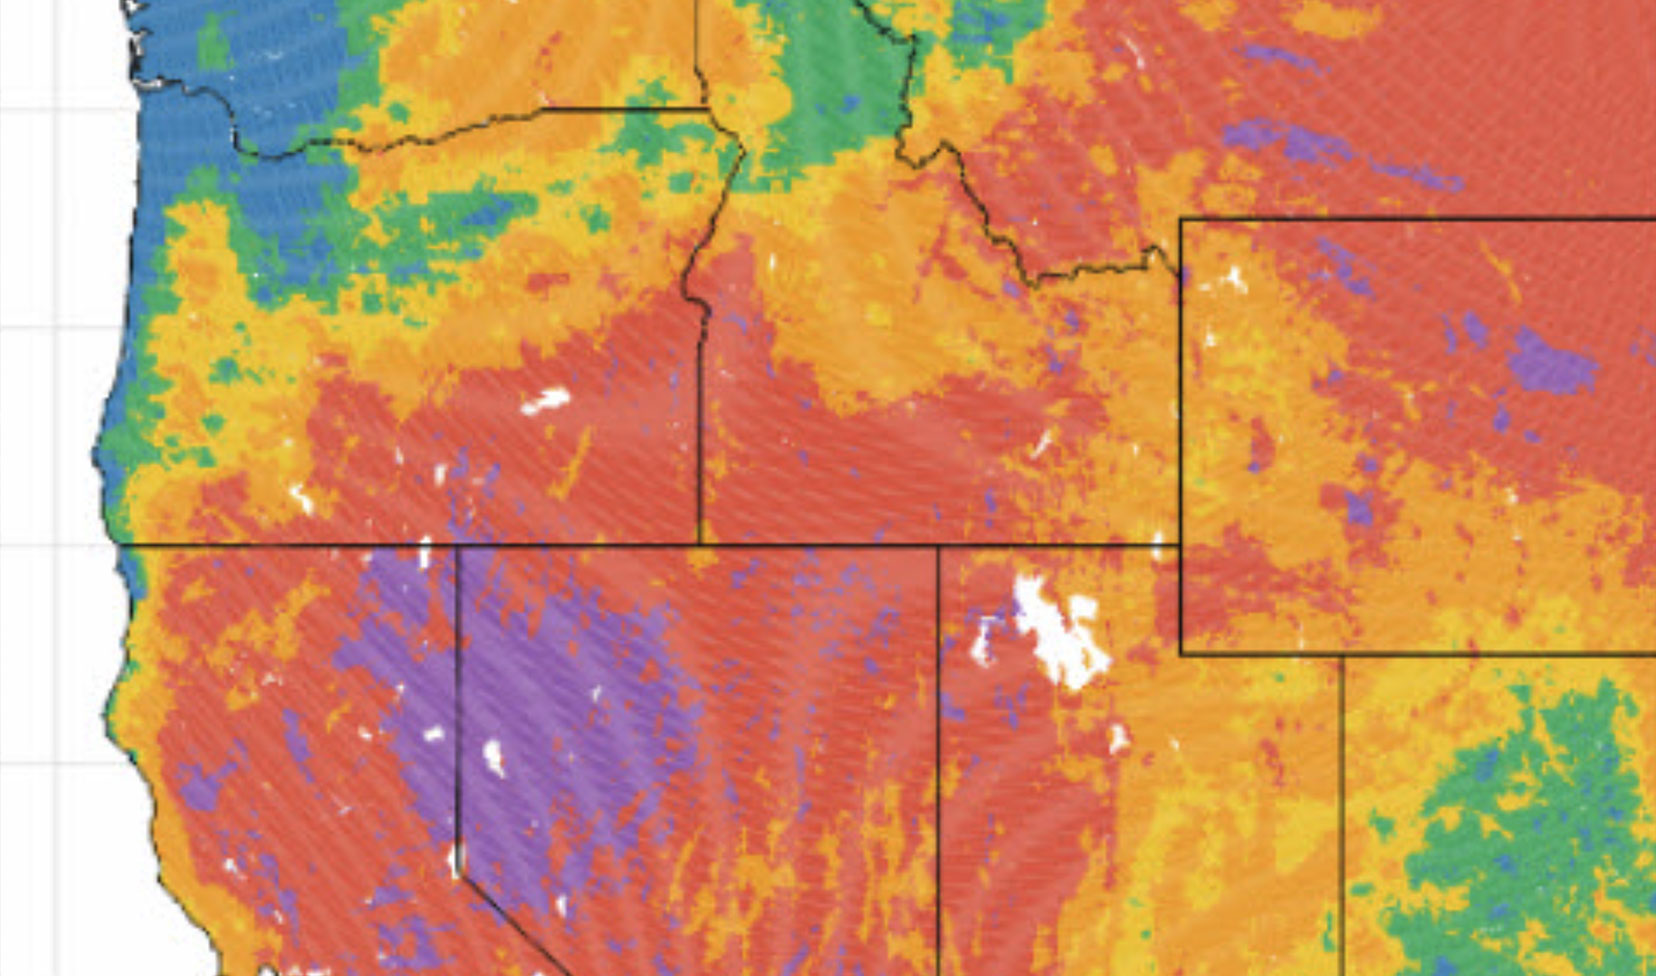
Predict localized extreme conditions.
Unique 2 km, 20+ years of historical re-analysis built with the precision, granularity, and context to help wildfire operations understand when conditions are truly extreme and take appropriate action.
Outcome-driven at operational scales.
Wind, humidity, temperature, and precipitation can all impact fire danger conditions, rate of spread and intensity. Technosylva’s advanced weather modeling is unique in a number of ways.
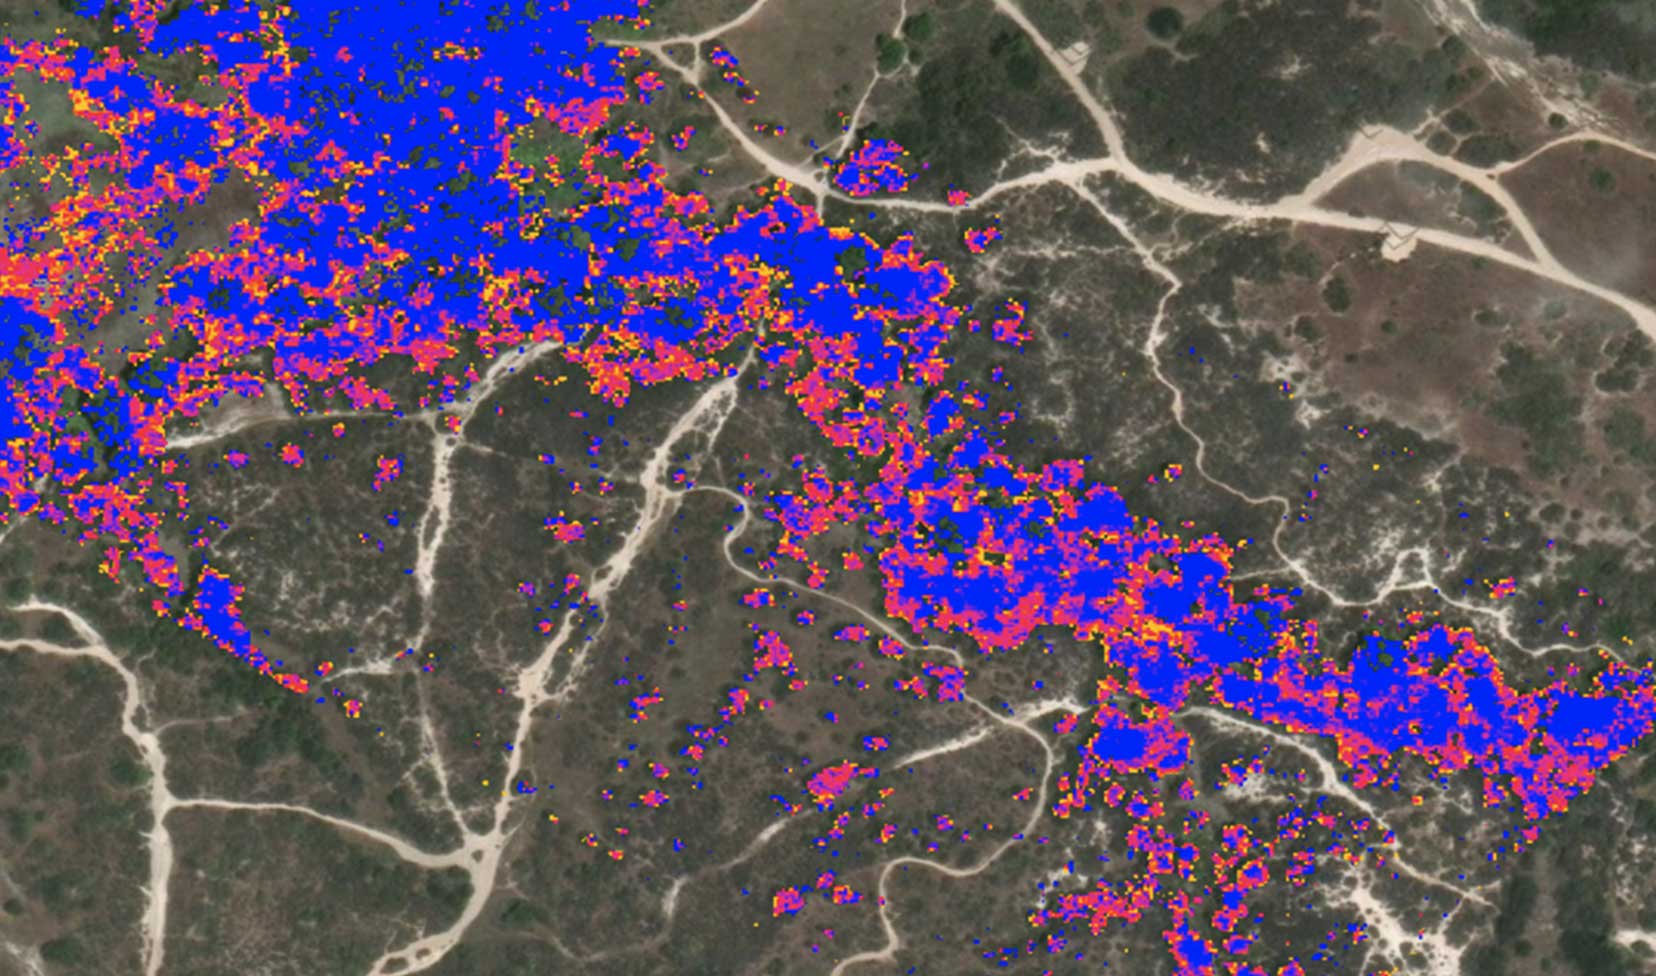
FUELS
Energy on the ground.
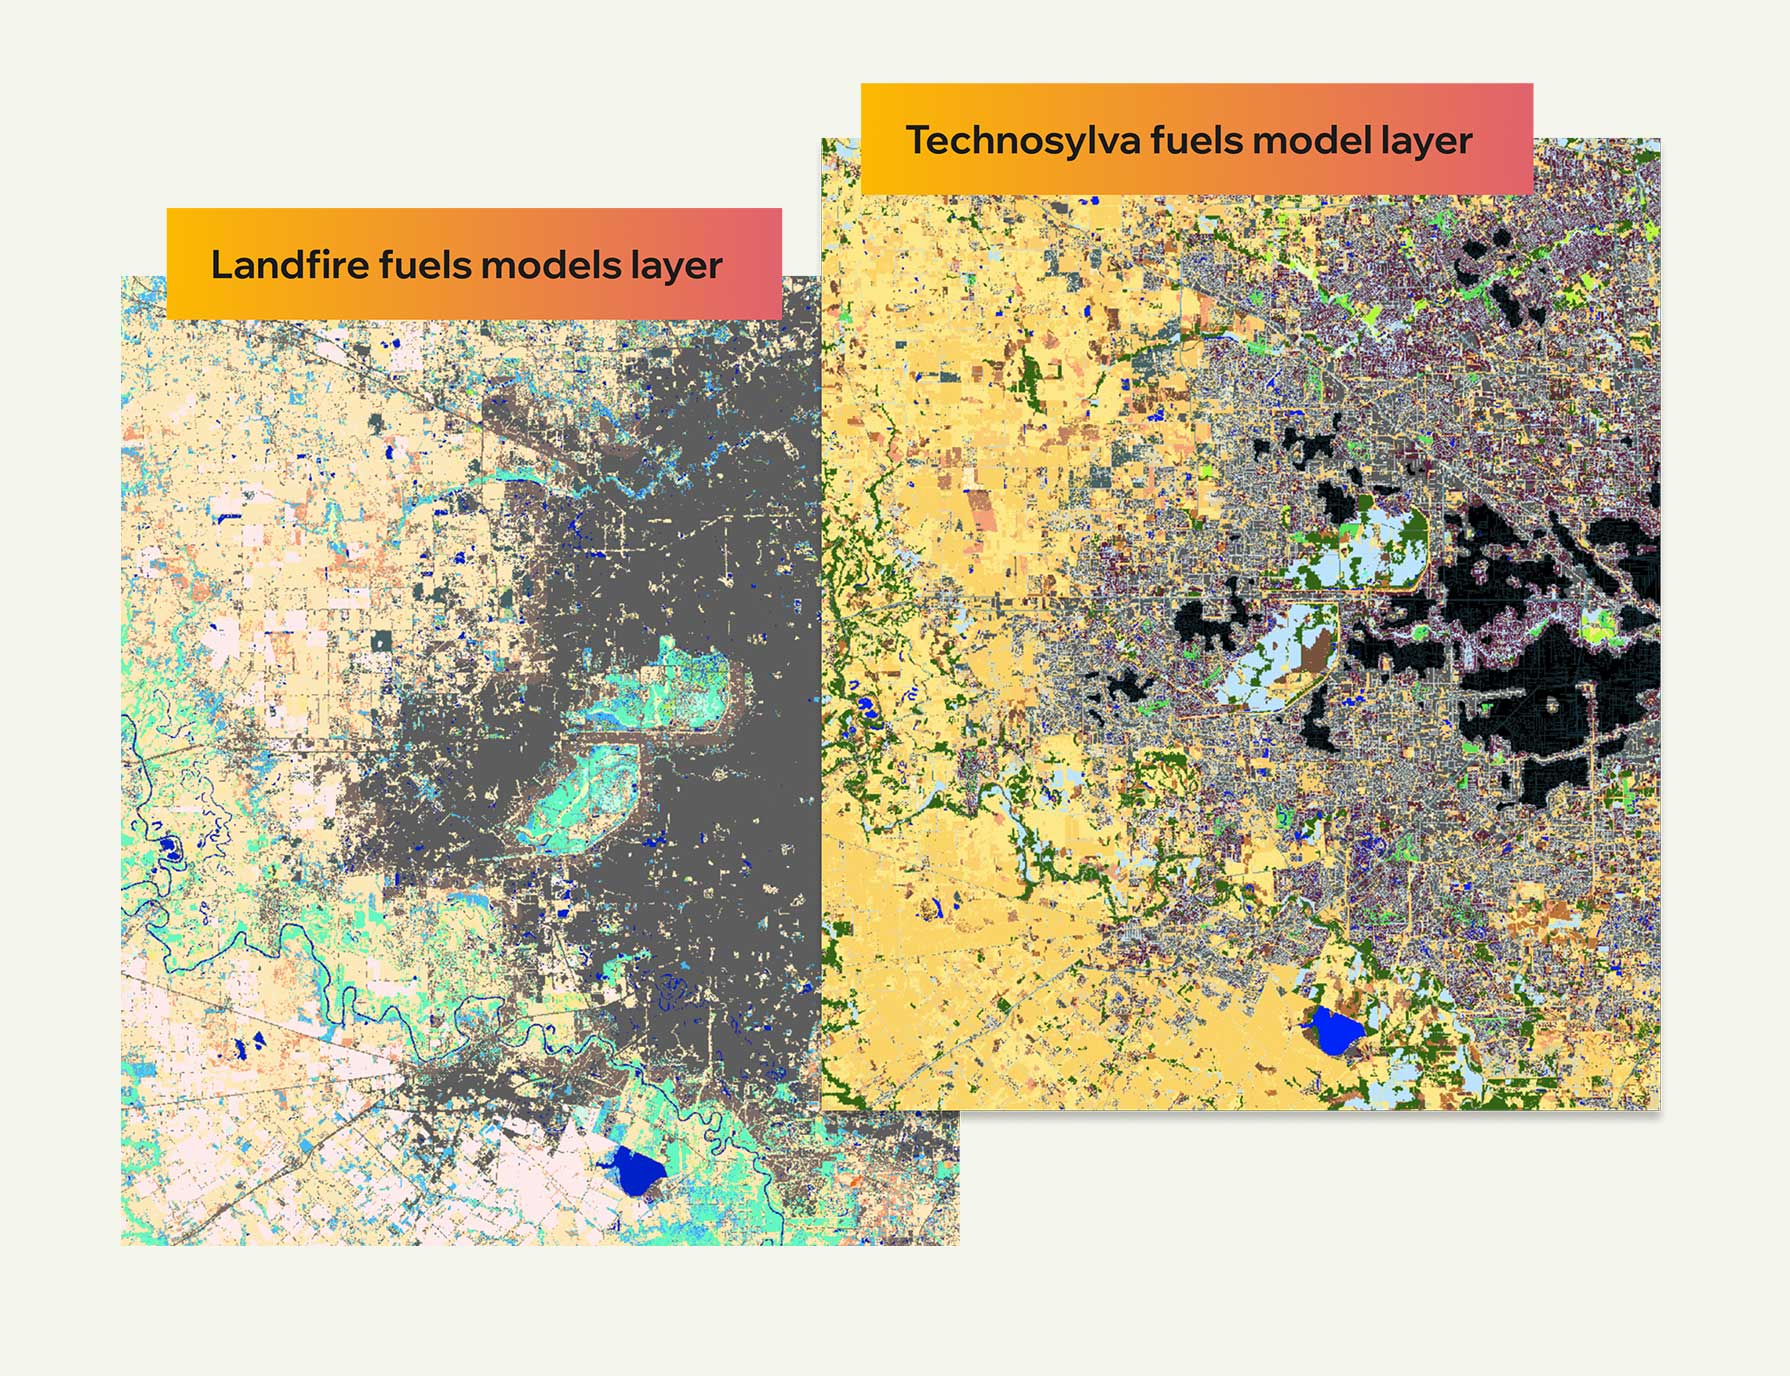
Accurately classifying and characterizing fuel types and moisture levels is critical to better fire behavior forecasts. In comparison to publicly available sources, such as LANDFire, Technosylva features several key differentiators that drive the quality of our fuels data.
-
Our AI object-based image analysis, paired with field data, results in a more accurate definition of fuel types. Regular updates capture changes to dynamic fuel conditions on the ground.
-
Fire behavior is not only about fuel type, but also how it is expected to behave under certain conditions. We refine each fuel class, such as grass loadings, based on historical fire behavior to ensure that our fuel categorizations translate into more accurate predictions.
-
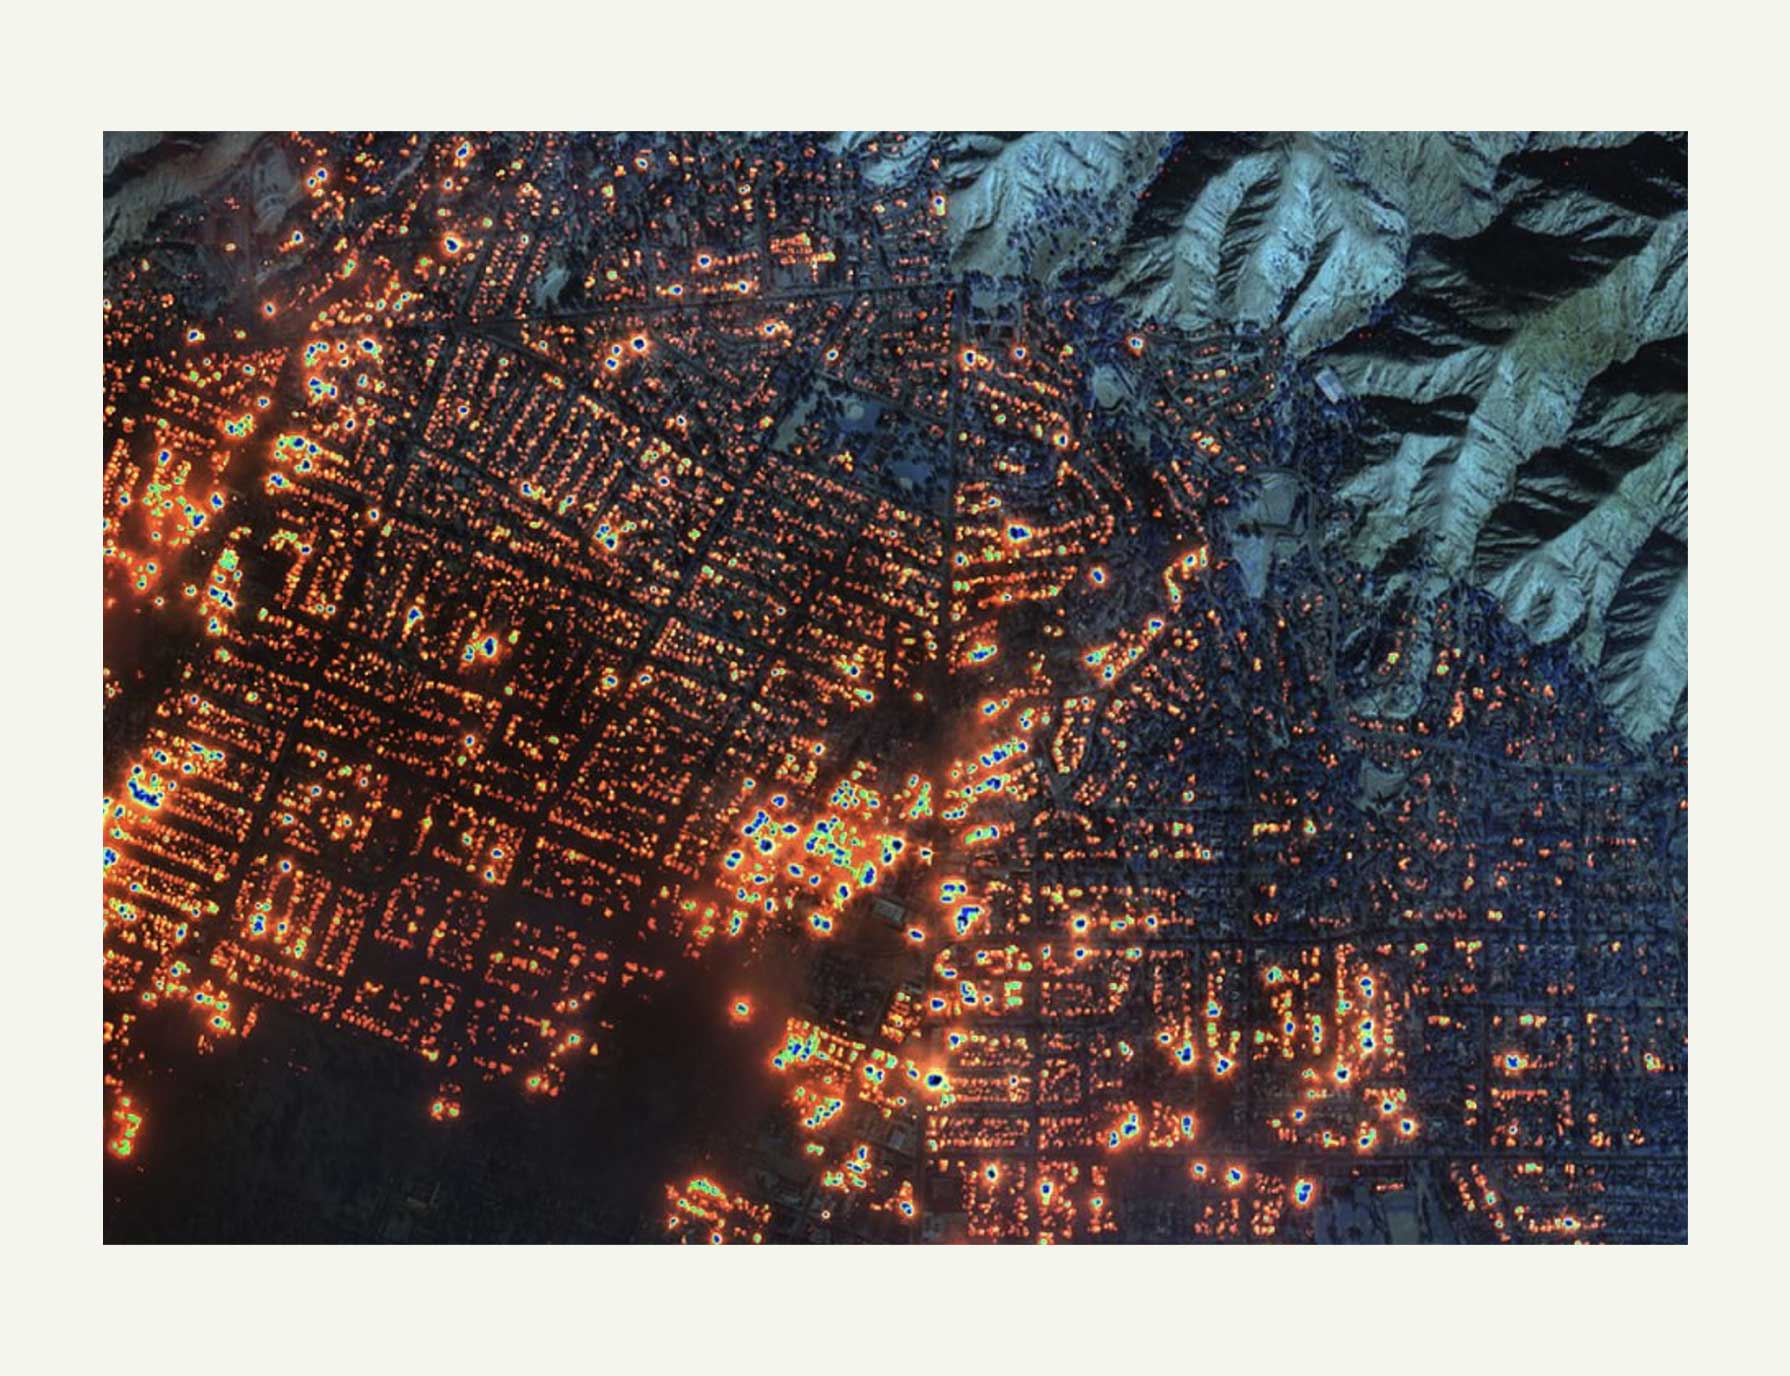
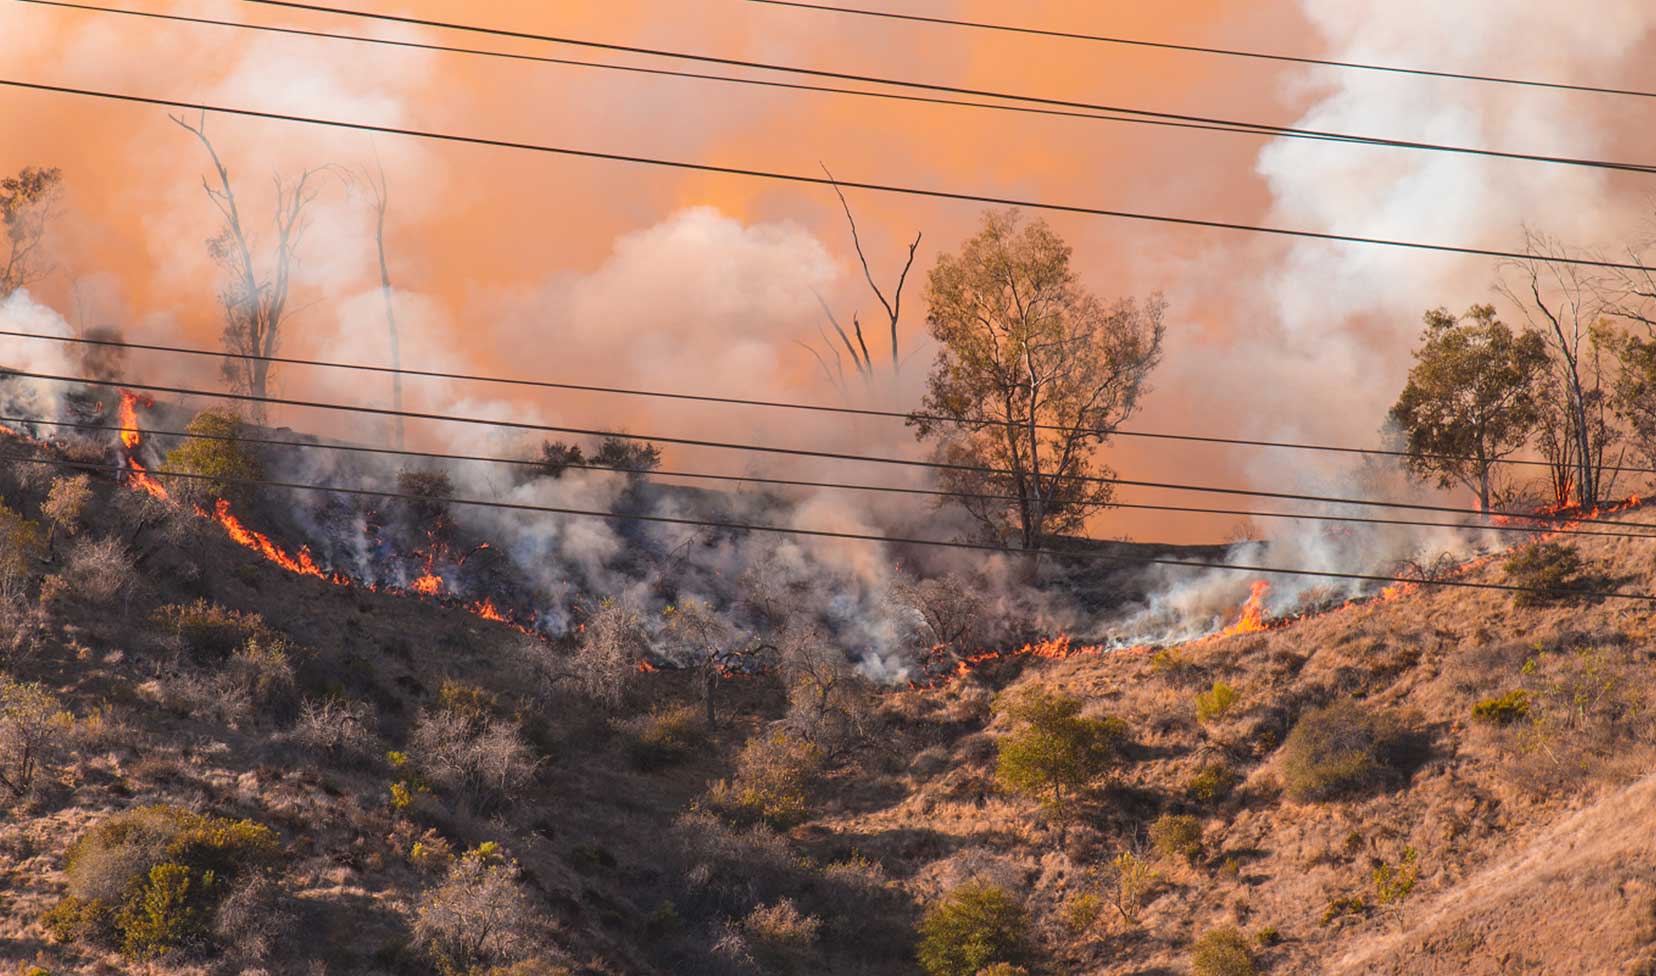
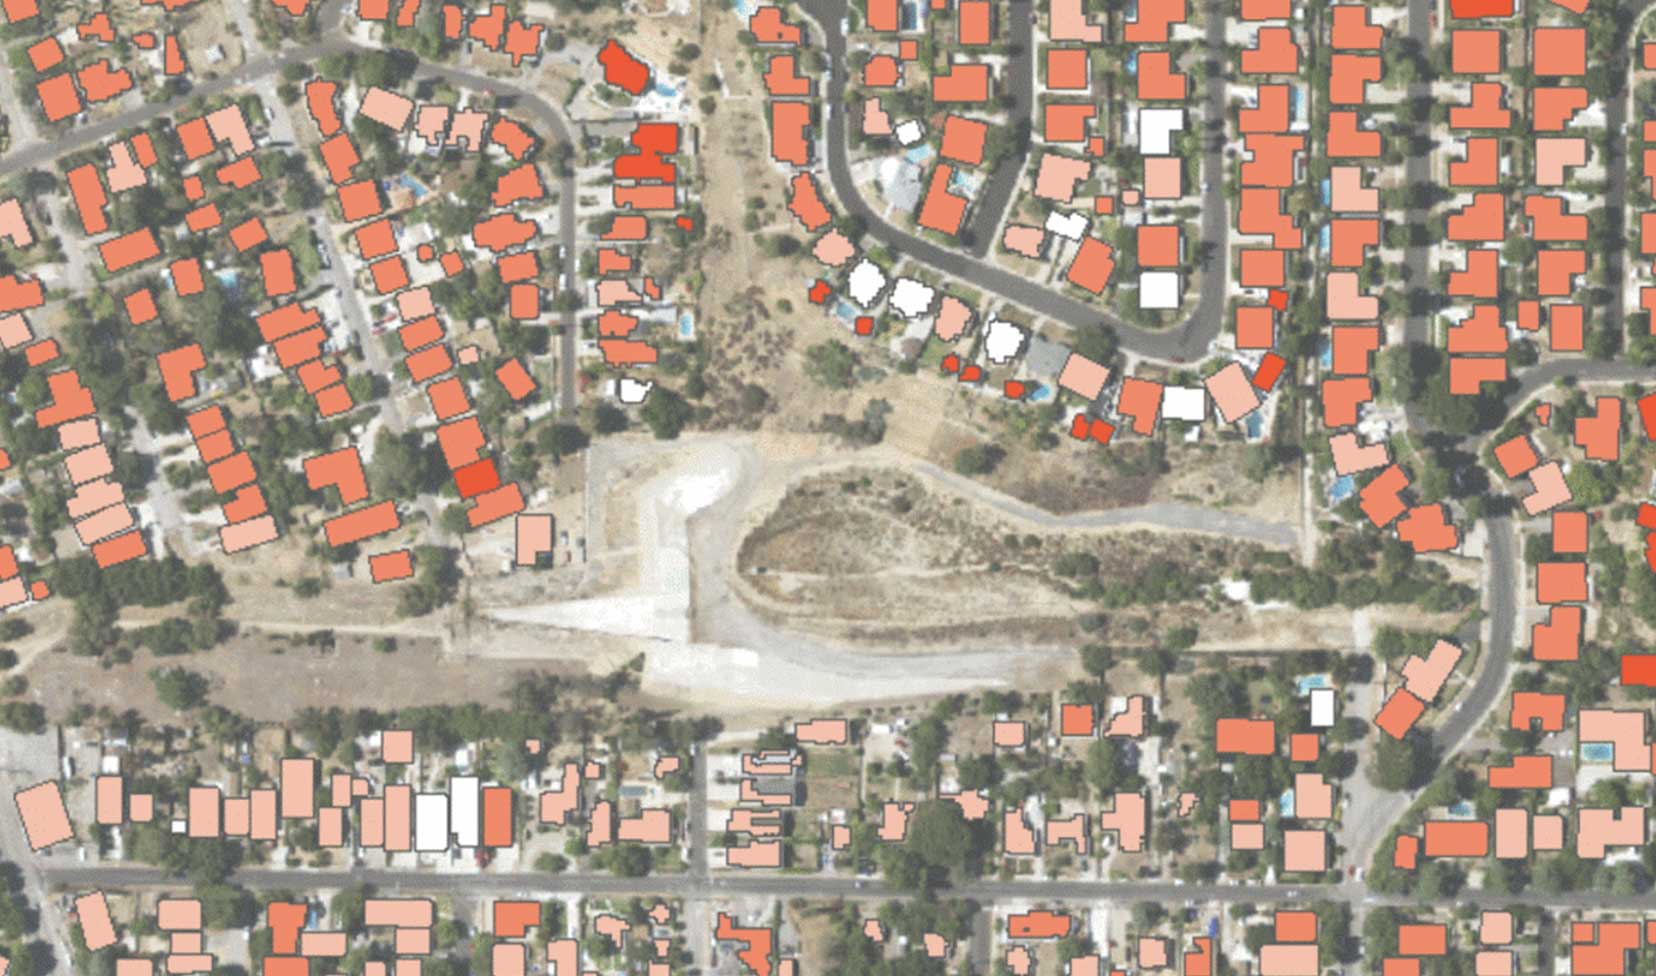
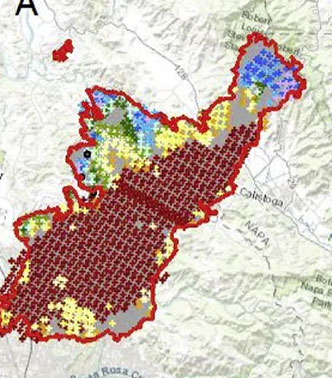
Many publicly available and competitor fuels consider urban areas non-burnable, which is evidently not the case based on recent catastrophic WUI wildfires. We have developed custom WUI fuel types to accurately capture risk and simulate wildfire spread in urban areas.
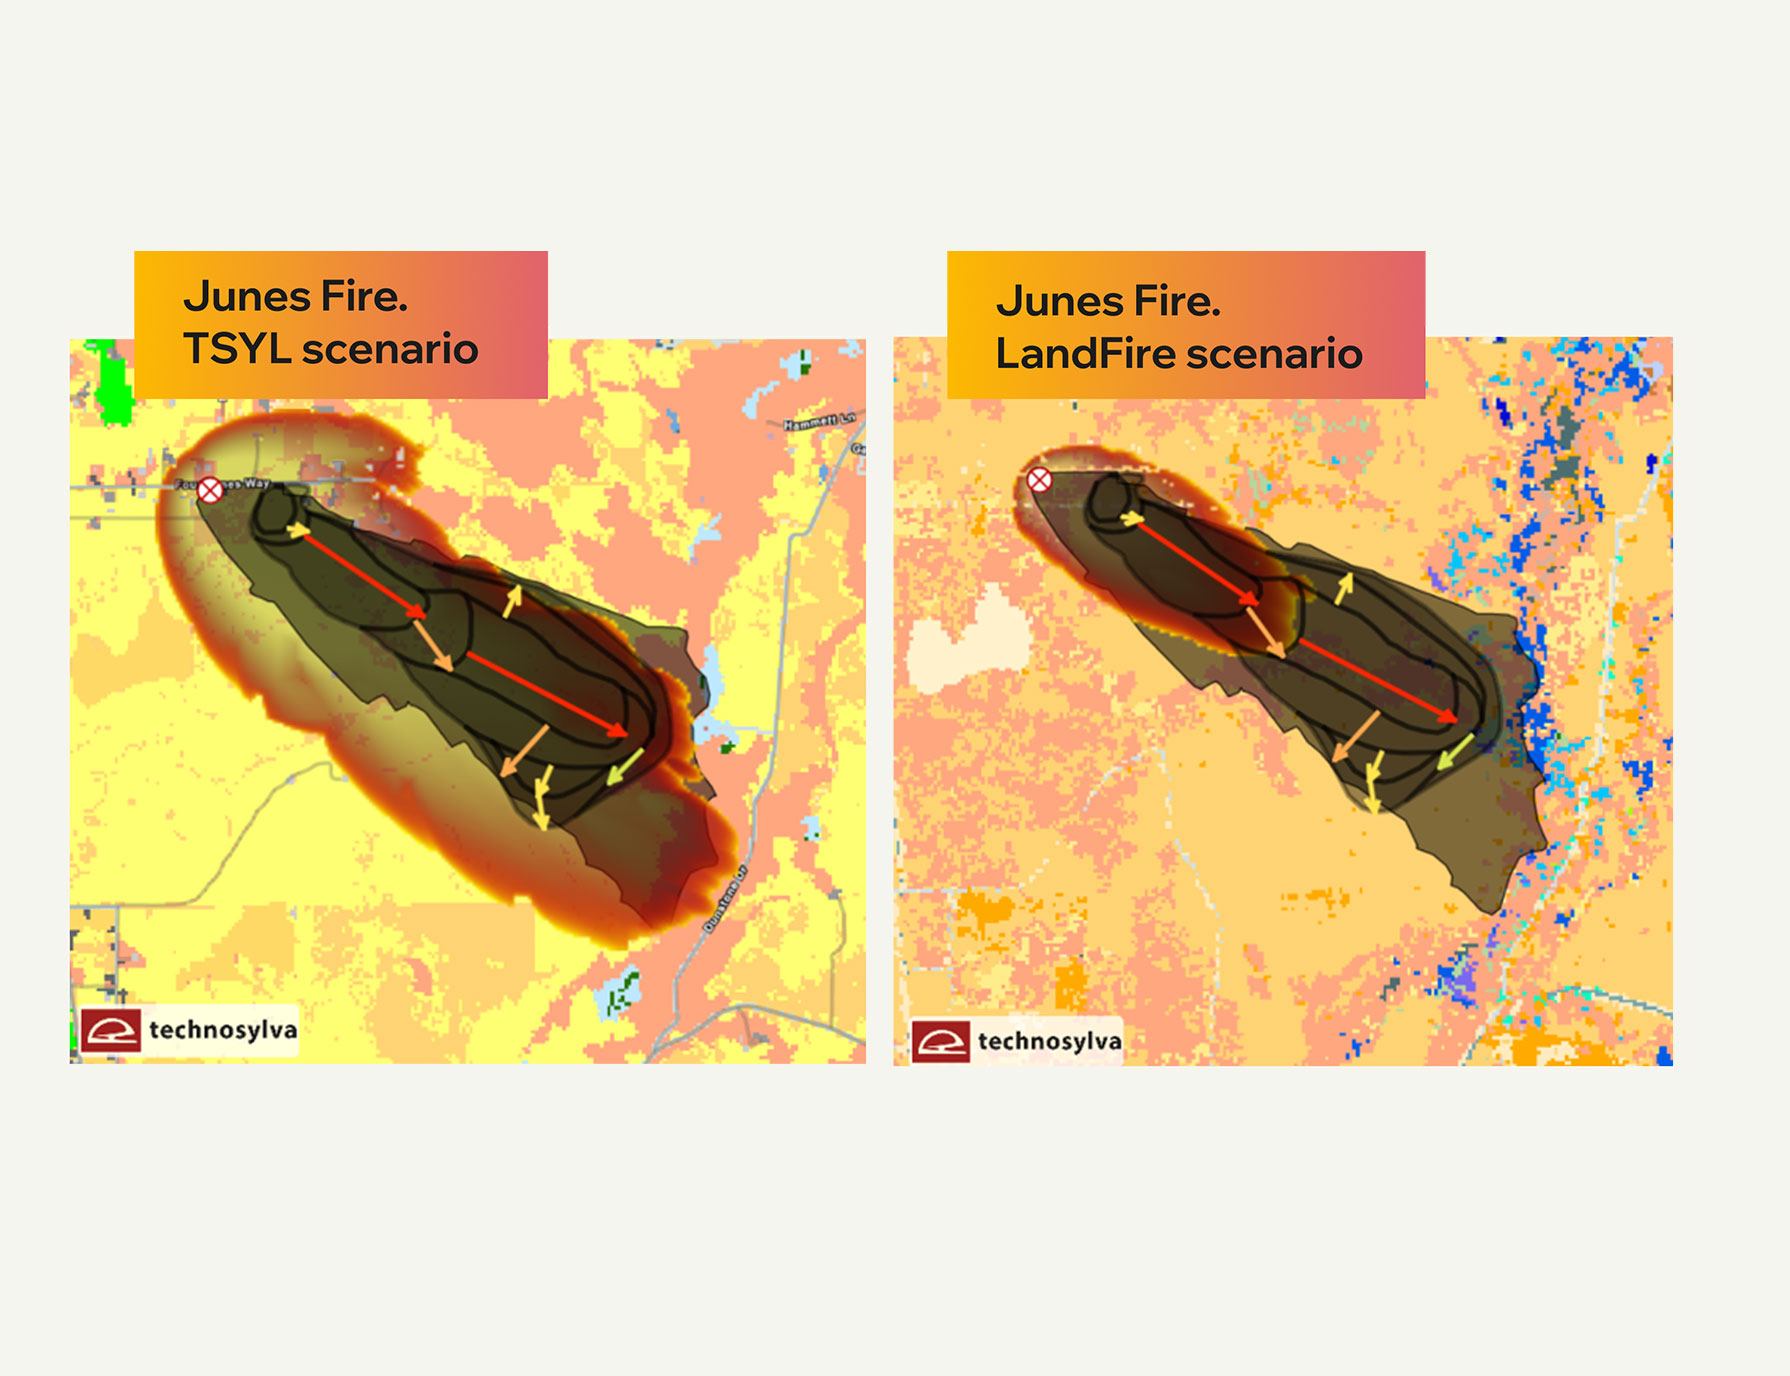
Comparing Technosylva fuels and public datasets.
| Technosylva proprietary fuels | LANDFIRE public data | Operational advantage | |
|---|---|---|---|
| Methodology | H3 Fuels + Object-based image analysis (OBIA) creates more realistic fuel delineation. | Pixel-based classification. | Better captures boundaries and improves transition between fuel types. |
| Input data | LiDAR + Satellite Imagery + UAV + Ground Truth points. | Relies on public sources | Enhanced accuracy and identification of fuels |
| Custom Fuels | Custom fuels for Shrubs, timber-understory and timber-litter models. Grass Fuel loadings. | Uses standard Scott & Burgan timber models with constant parameters. | Improves congruence with observed fire behavior. |
| WUI Fuels | 21 WUI fuel types to map WUI characteristics. | Urban areas are non-burnable. | Supports modeling of fire spread into urban environments. |
| Refresh cycle | Updated monthly during fire season | Typically updated on a much slower annual cycle. | Up-to-date layers capture recent burns, disturbances, and seasonal grass changes. |
| Validation & QA | Dedicated Data QA team + Scientific and Operational validation with Fire Agencies (CAL FIRE, TFS) | No equivalent validation process published. | Stronger QA/Validation increases operational confidence in both fuels and fire-behavior outputs. |
| Continuous fuels | Dynamic fuel loadings for each location based on LiDAR data. | Static fuel loadings by fuel type. | Reflects real world variability and conditions. |
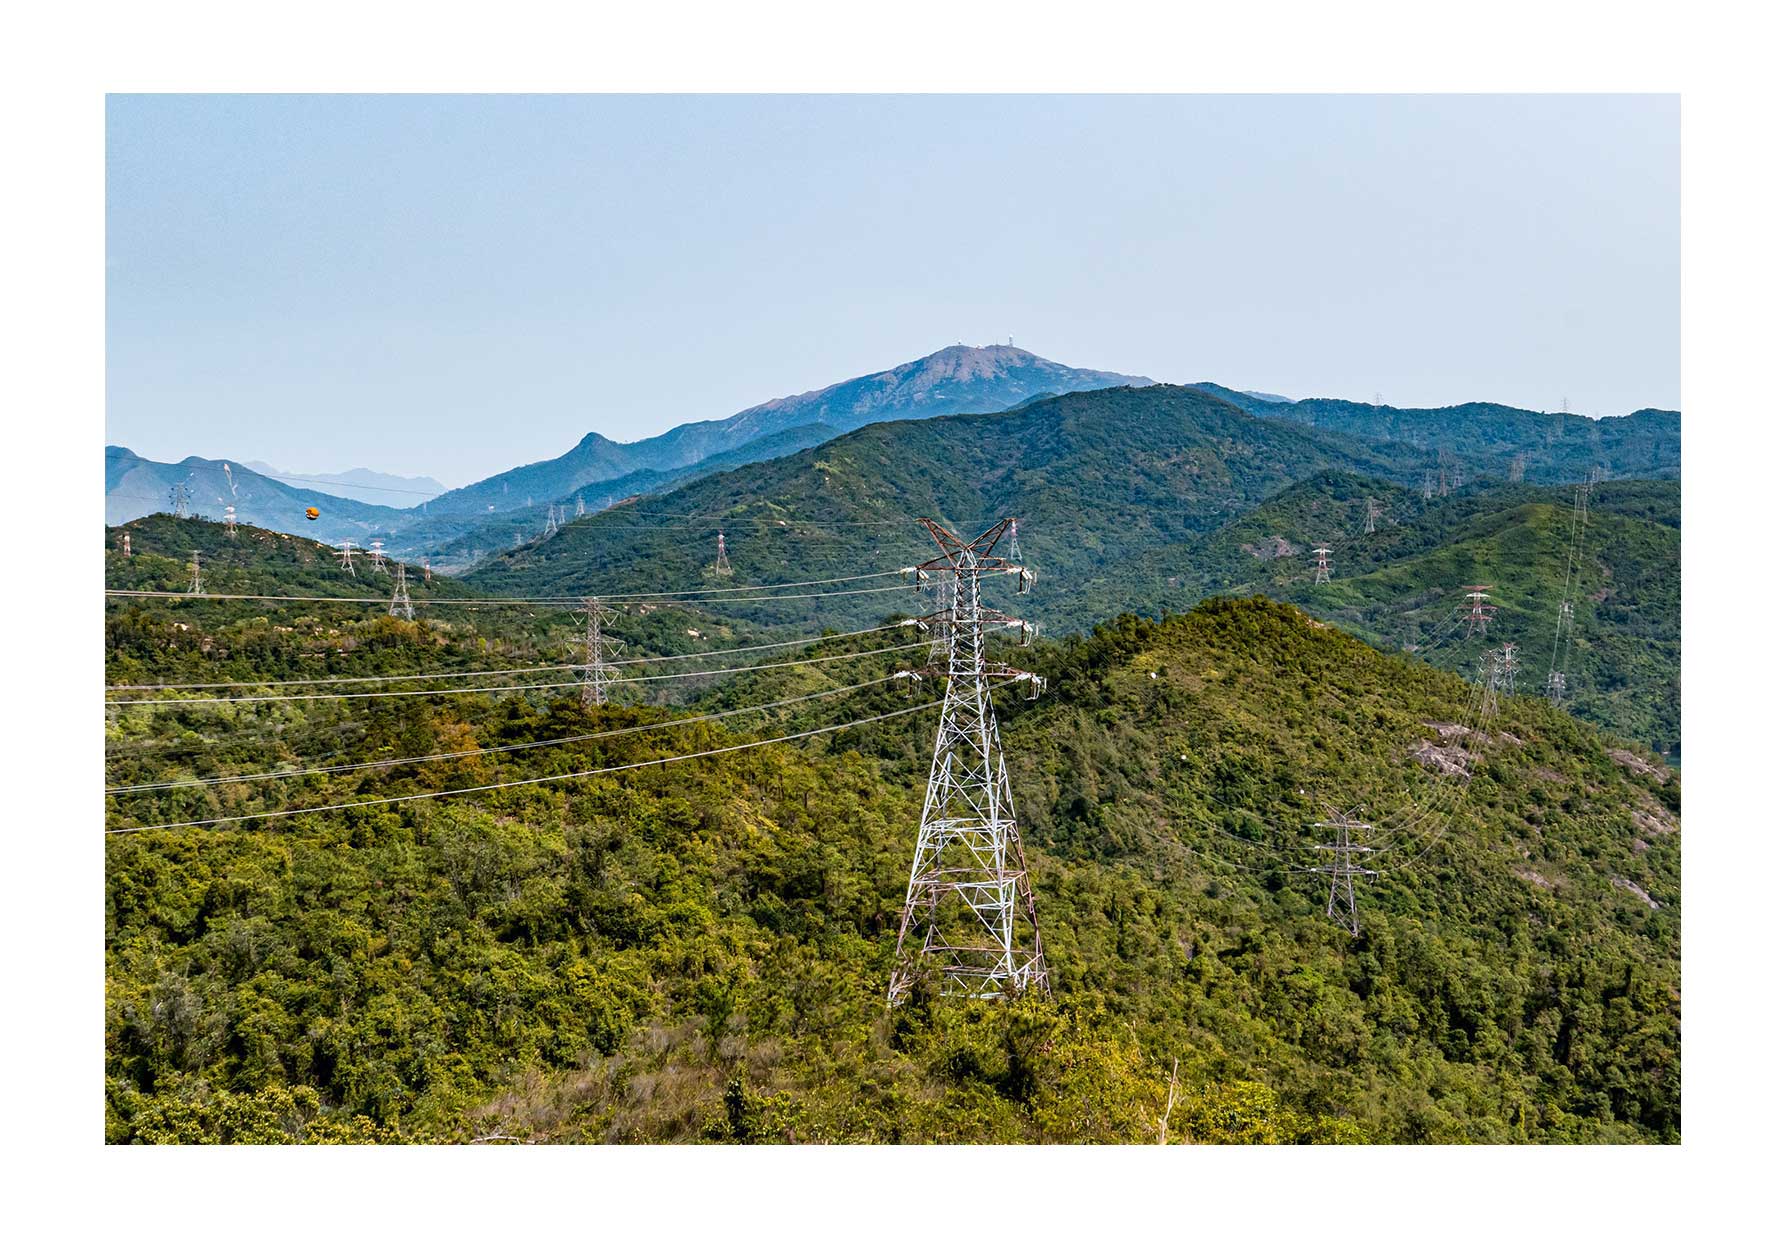
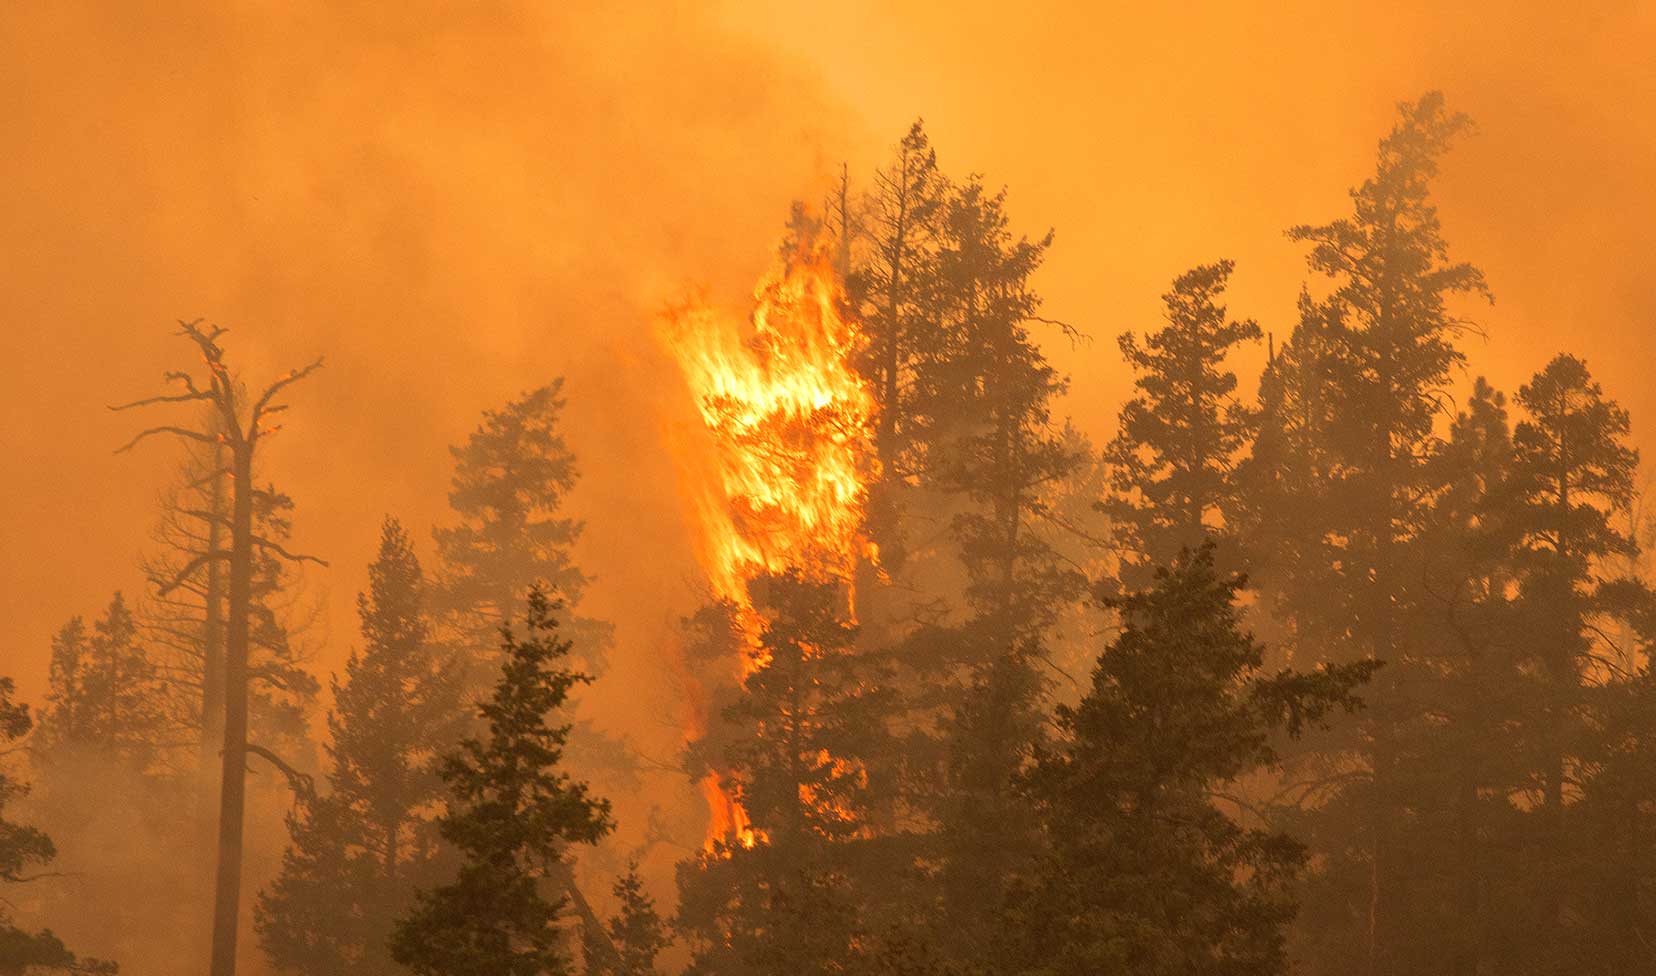
TOPOGRAPHY
Features of the land.
Topography dictates fire speed, intensity and direction through terrain features like slope and aspect. Our approach to topography includes:
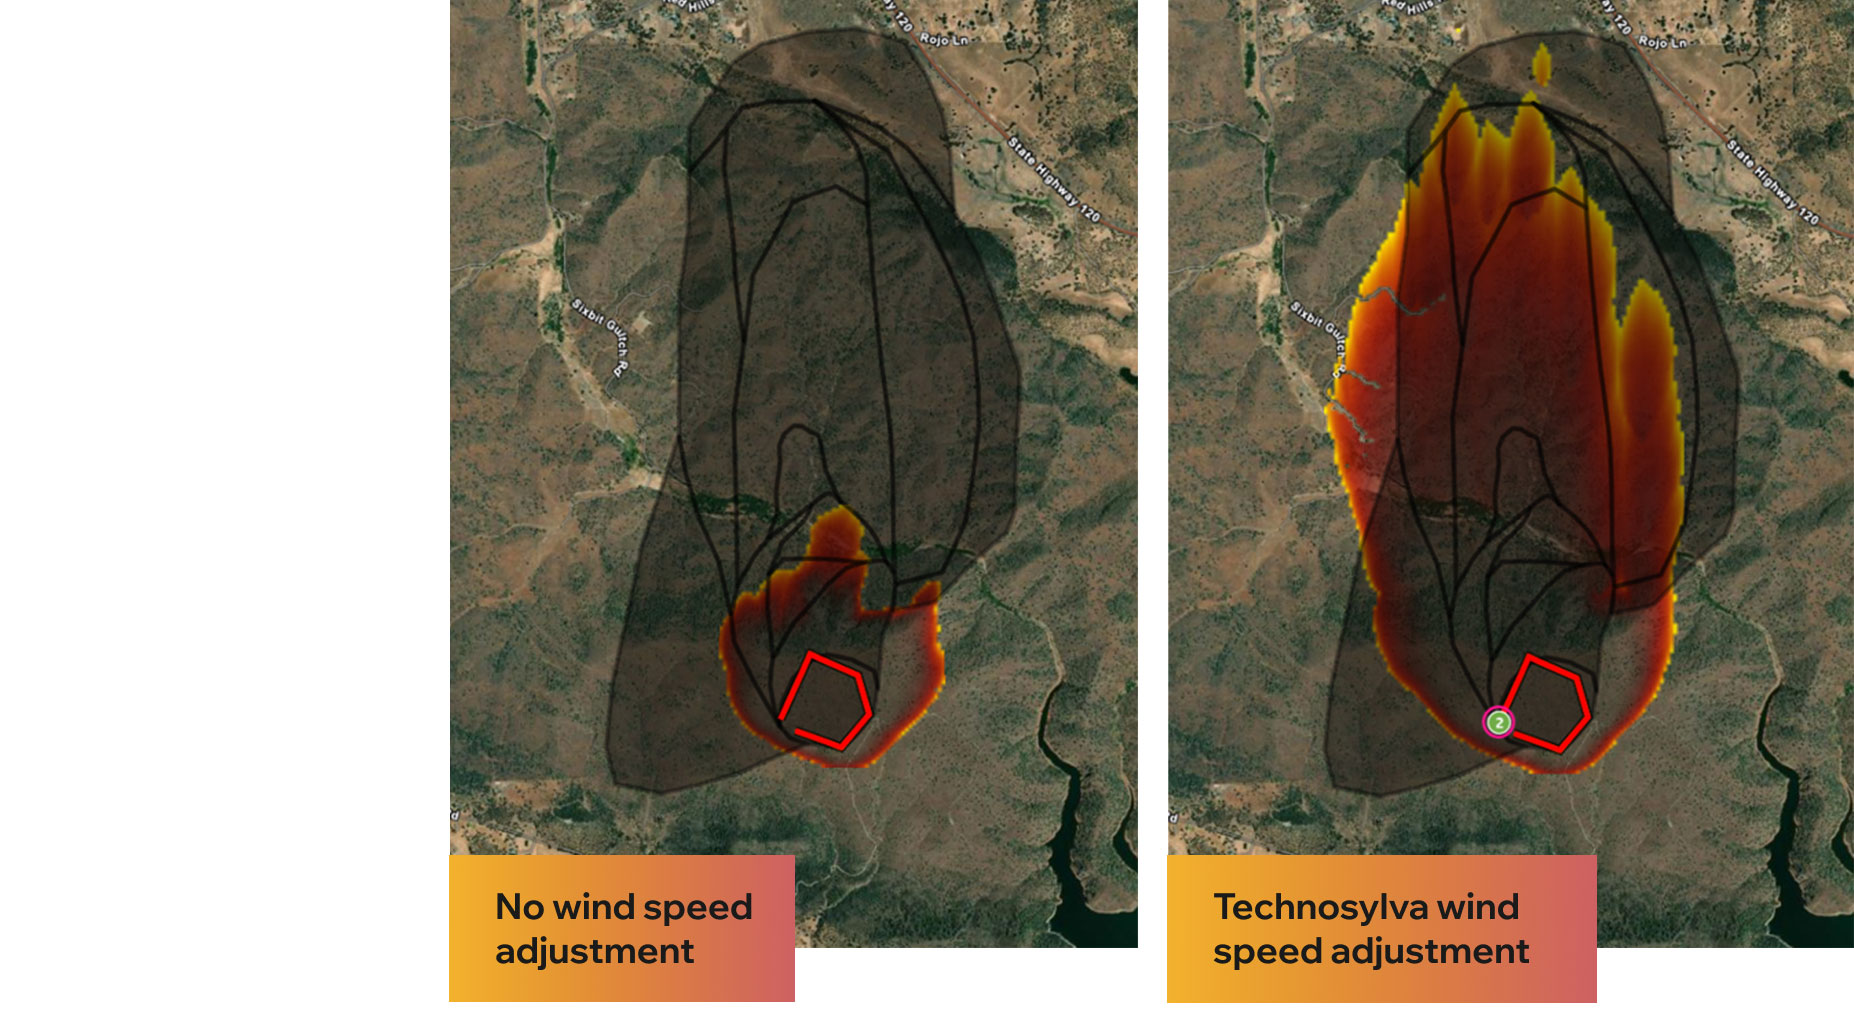
-
Our weather models are downscaled to a fine resolution to capture how wind speeds interact with mountainous areas. Models with larger weather grids “smooth” out mountains and slopes critical to localized wind conditions that drive rate of spread.
-
We collaborate with renowned institutions, such as NASA and the Missoula FireLab, to develop tools that match the operational constraints of responders in the field.
-
Our terrain difficulty is a unique composite index responders can use to understand the ability of ground resources to access a fire, reach the location of ignition, and effectively extinguish. Most terrain indices are static. Ours evolves with changing fuel conditions to provide the most up-to-date intelligence to world class agencies in the field.
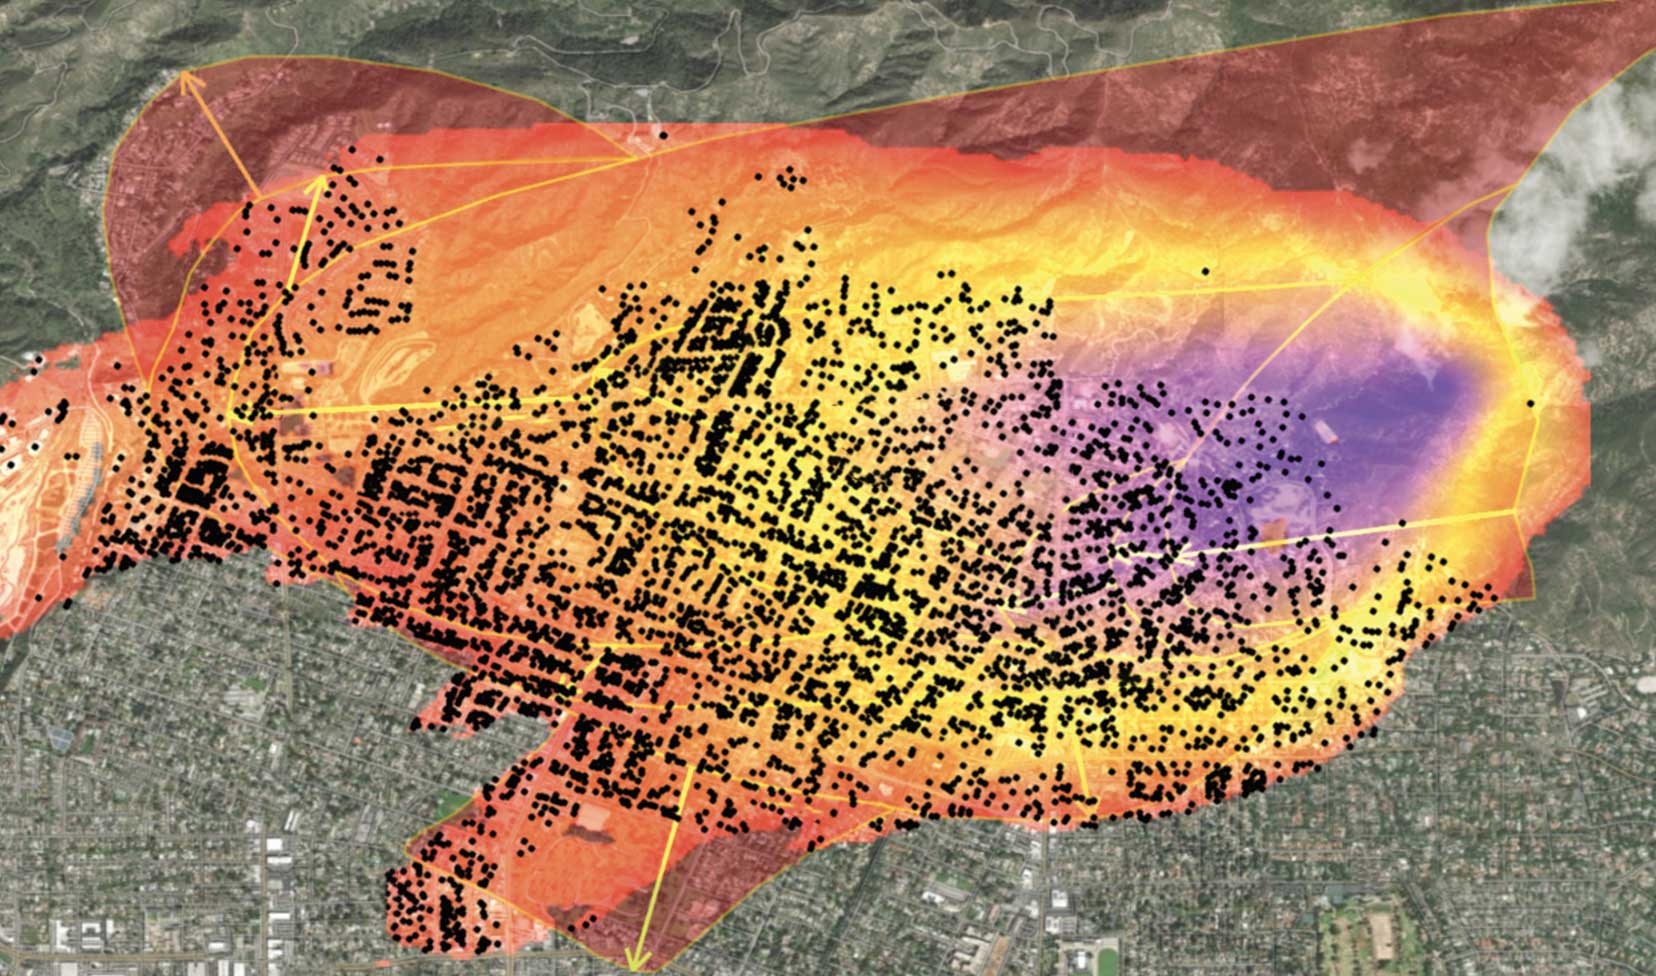
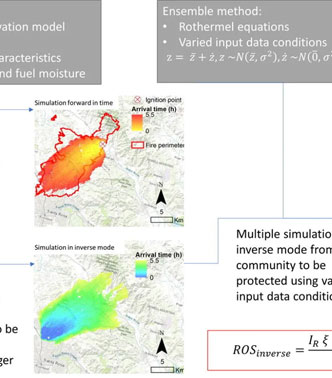
Multiple models for the best fit.
Fire doesn’t behave “one way”, and one model won’t capture real risk and danger. Our approach incorporates ensemble modeling, which evaluates multiple models concurrently—calibrating and selecting the best fit for local conditions rather than relying on a single model. Technosylva’s advanced research, including peer-reviewed and published works, are continuously working to capture every meaningful piece of fire behavior modeling.
Fuel model optimization

Fuel moisture content
Spotting behavior
Crown fire spread
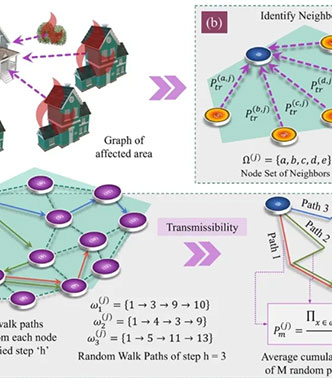
Dynamic building loss factor
Wildland-Urban Interface (WUI) modeling
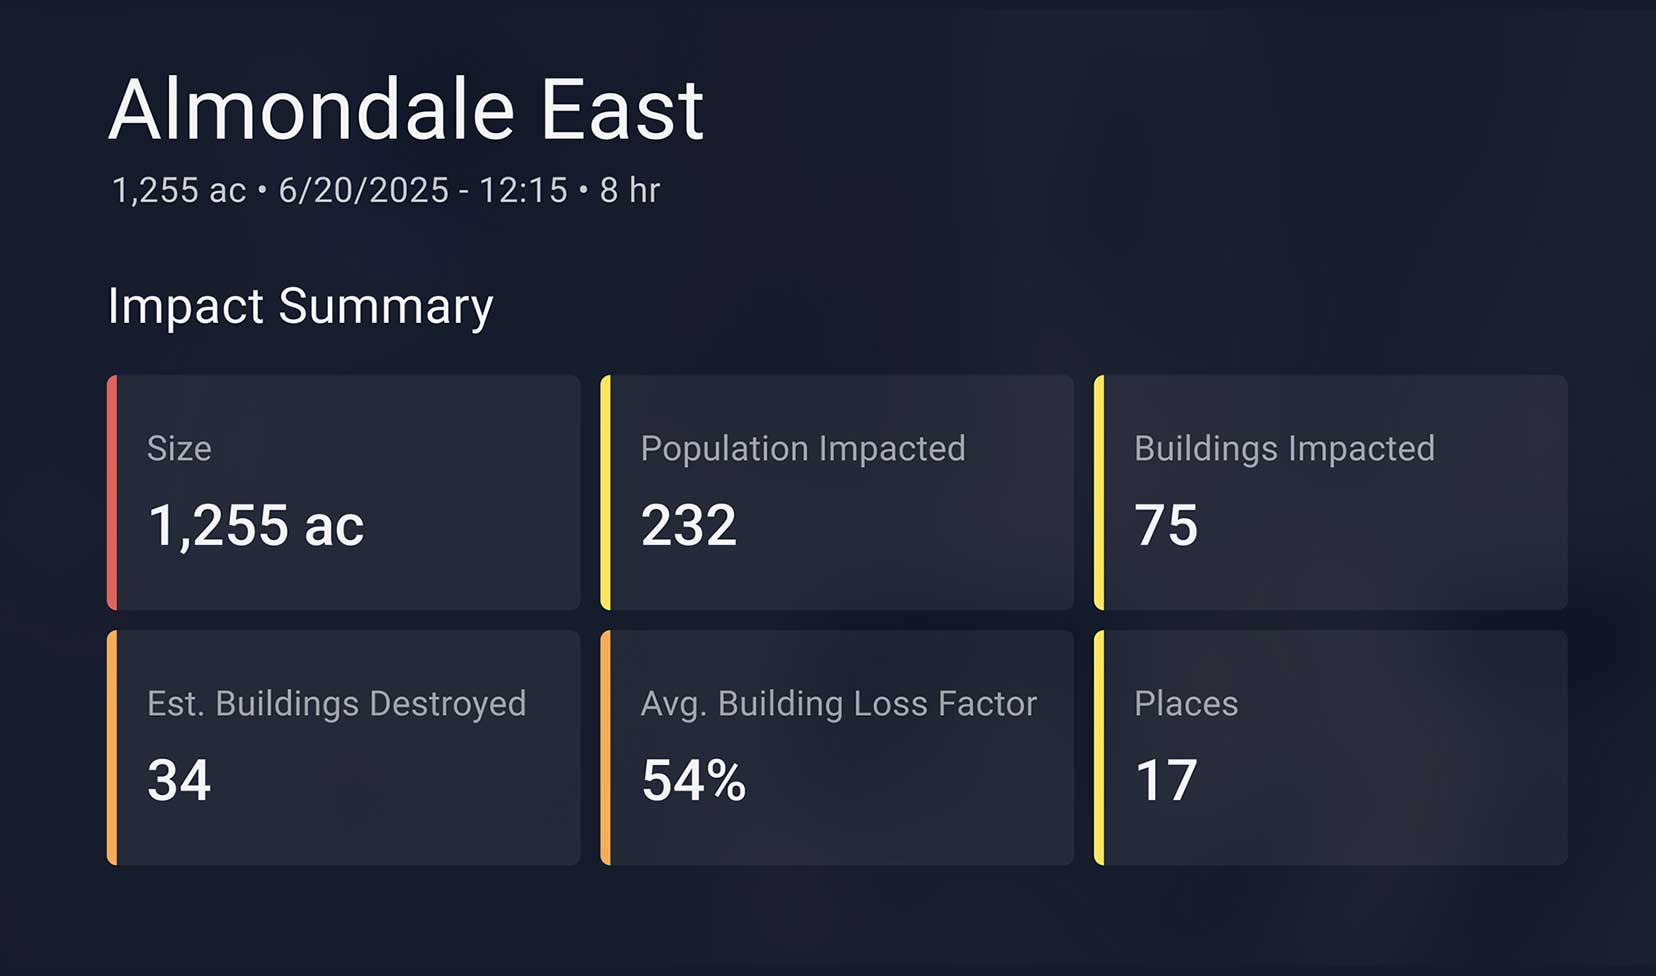
Consequence and impact quantification
Fire simulation options and computational speed
Proprietary fire danger indices
Related reading


See how our wildfire modeling works in your territory.
We’ll help you better understand your wildfire and extreme weather risks and discuss your next steps. Tell us what you need, and we’ll connect you with the right team member.