WILDFIRE OPERATIONS (FIRERISK™)
Get ahead of the danger.
Our fire and extreme weather capabilities are trusted by major fire agencies and utility companies around the world to make high-stakes operational decisions around near-term mitigation, resourcing and placement, and PSPS events. These validated, AI- and science-enabled predictive modeling tools forecast and monitor wildfire risk scenarios with the granularity and accuracy critical to ops scenarios.
Know what happens if an asset starts a fire.
When you know the outcomes, you can prepare for the consequences. Only Technosylva develops and curates the best data and science, integrating critical fire danger insights from weather forecasts, ignition models, impact analysis, and other high-quality sources to help you predict wildfire behavior based on learnings from billions of fire simulations.
- Asset ignition consequences inform prioritization
- Fire Index leverages multiple factors beyond just wind
- CAD/IRWIN integrations eliminate delays and duplications
- 30+ years of historical risk metrics frame real-time weather data
- Territory and asset level risk show the complete picture
What can you do with simulations in under 30-seconds?
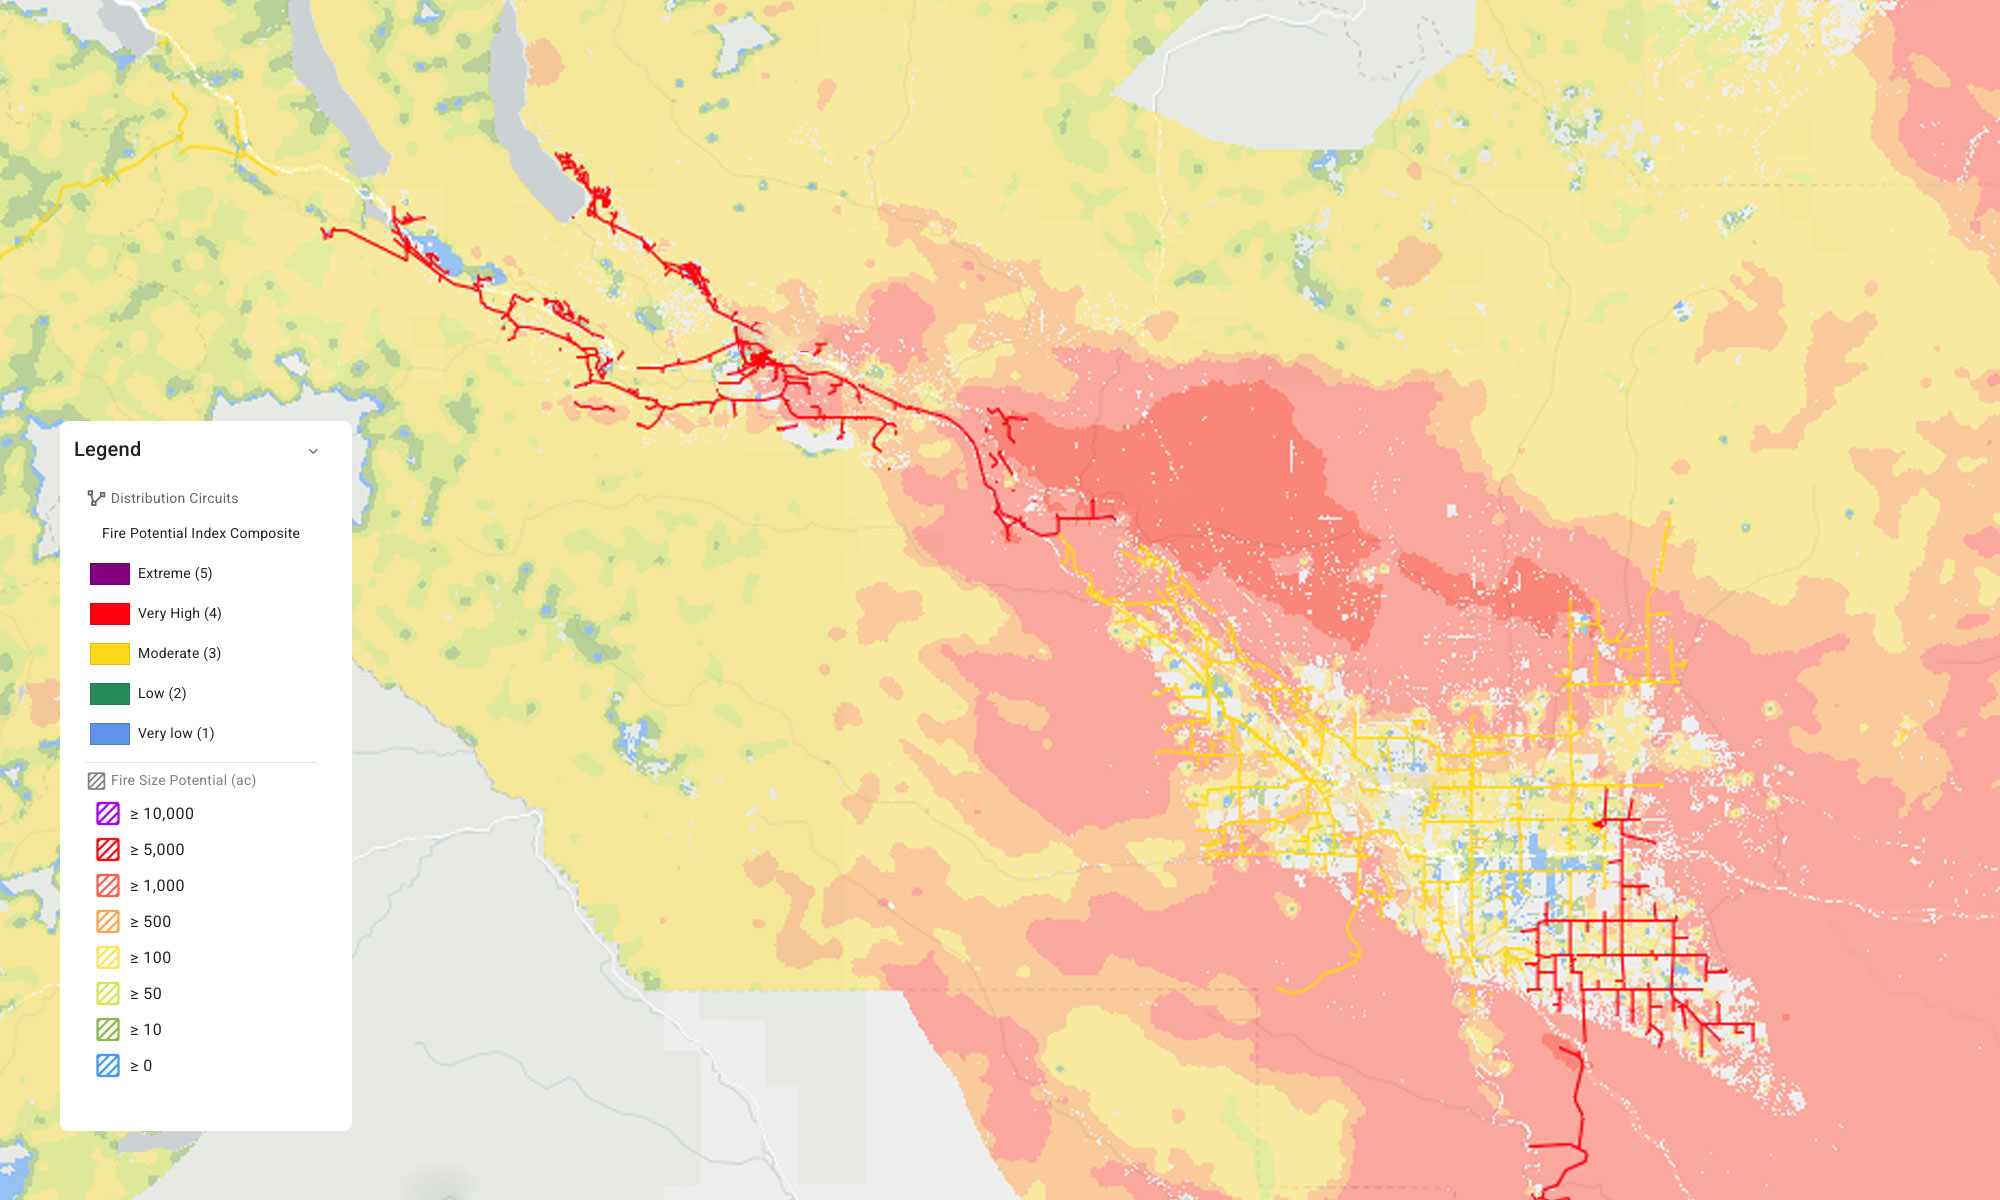
WILDFIRE RISK FORECASTING
Protect public safety.
Validated by fire agencies on the frontlines, our fire and extreme weather operations capabilities run hundreds of millions of simulations nightly to derive wildfire risk metrics. These metrics help you identify areas and levels of concern so you can get crews to the right places fast.
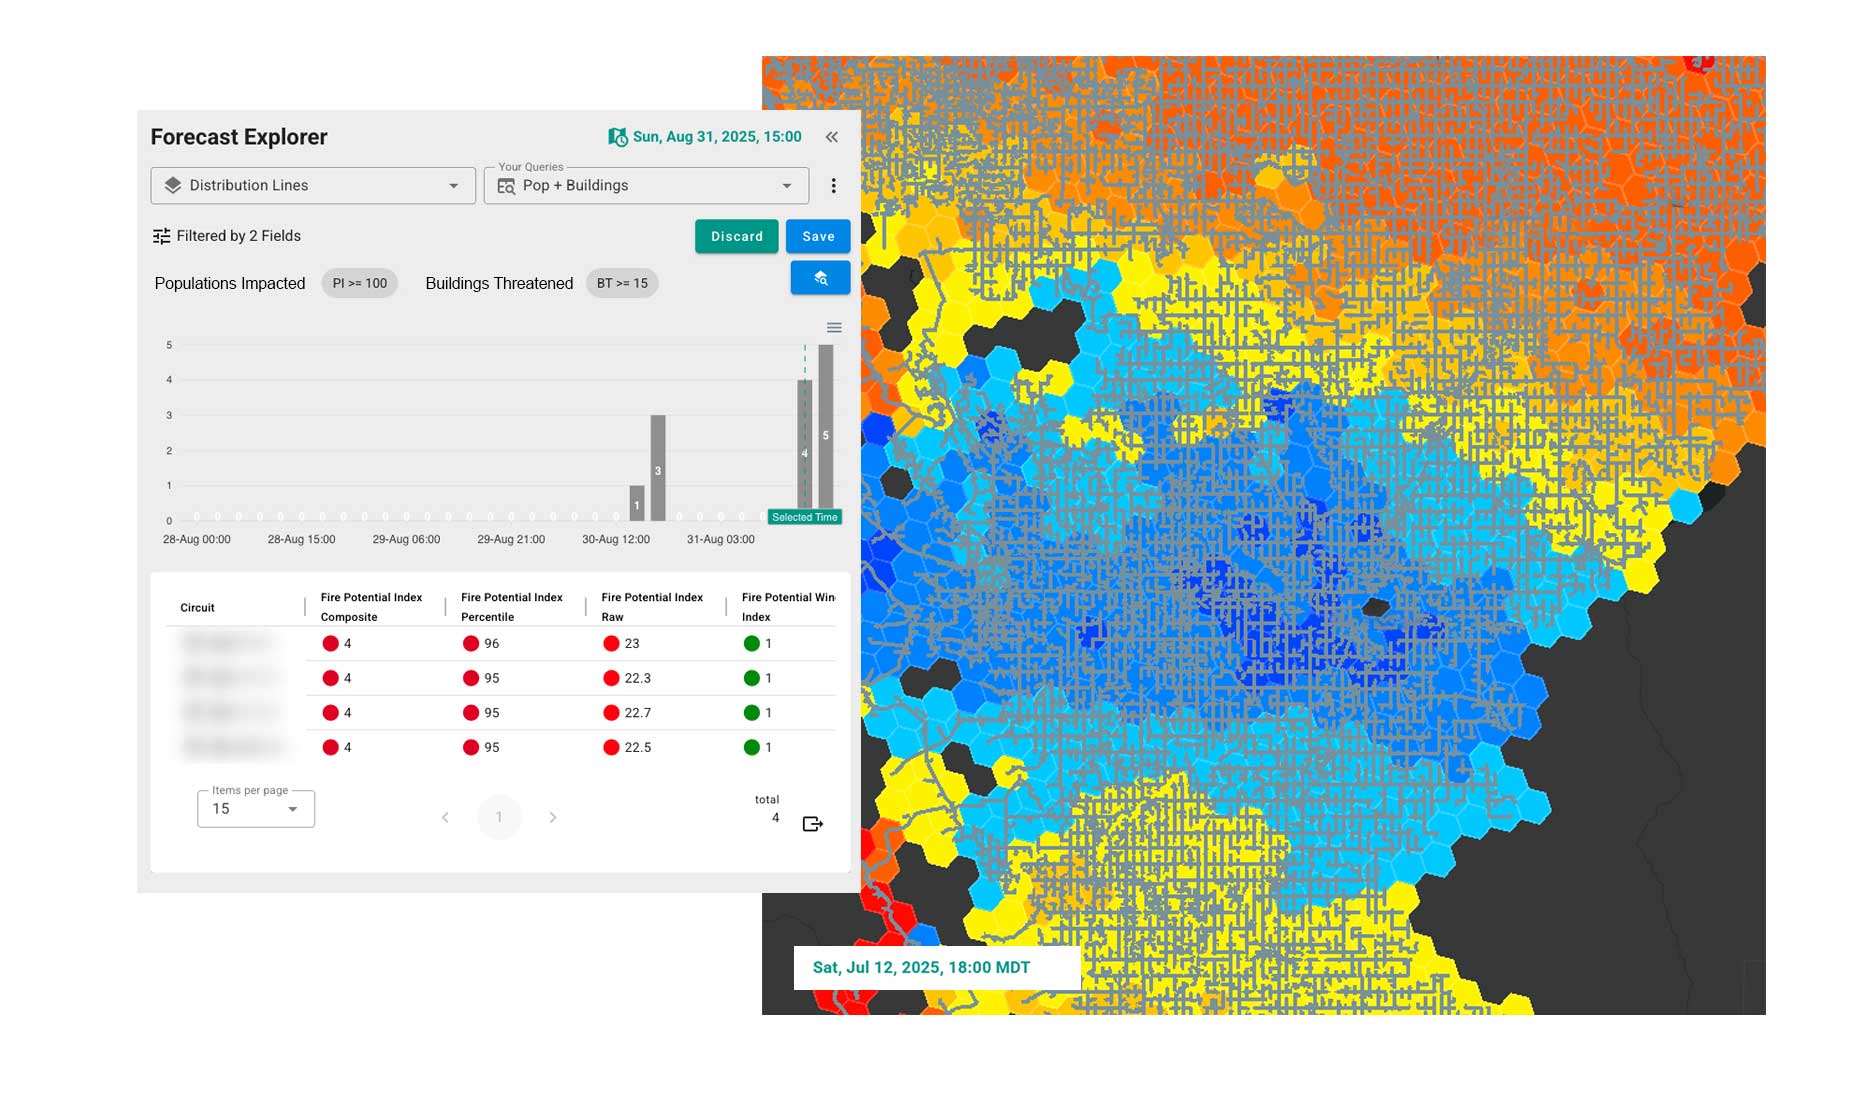
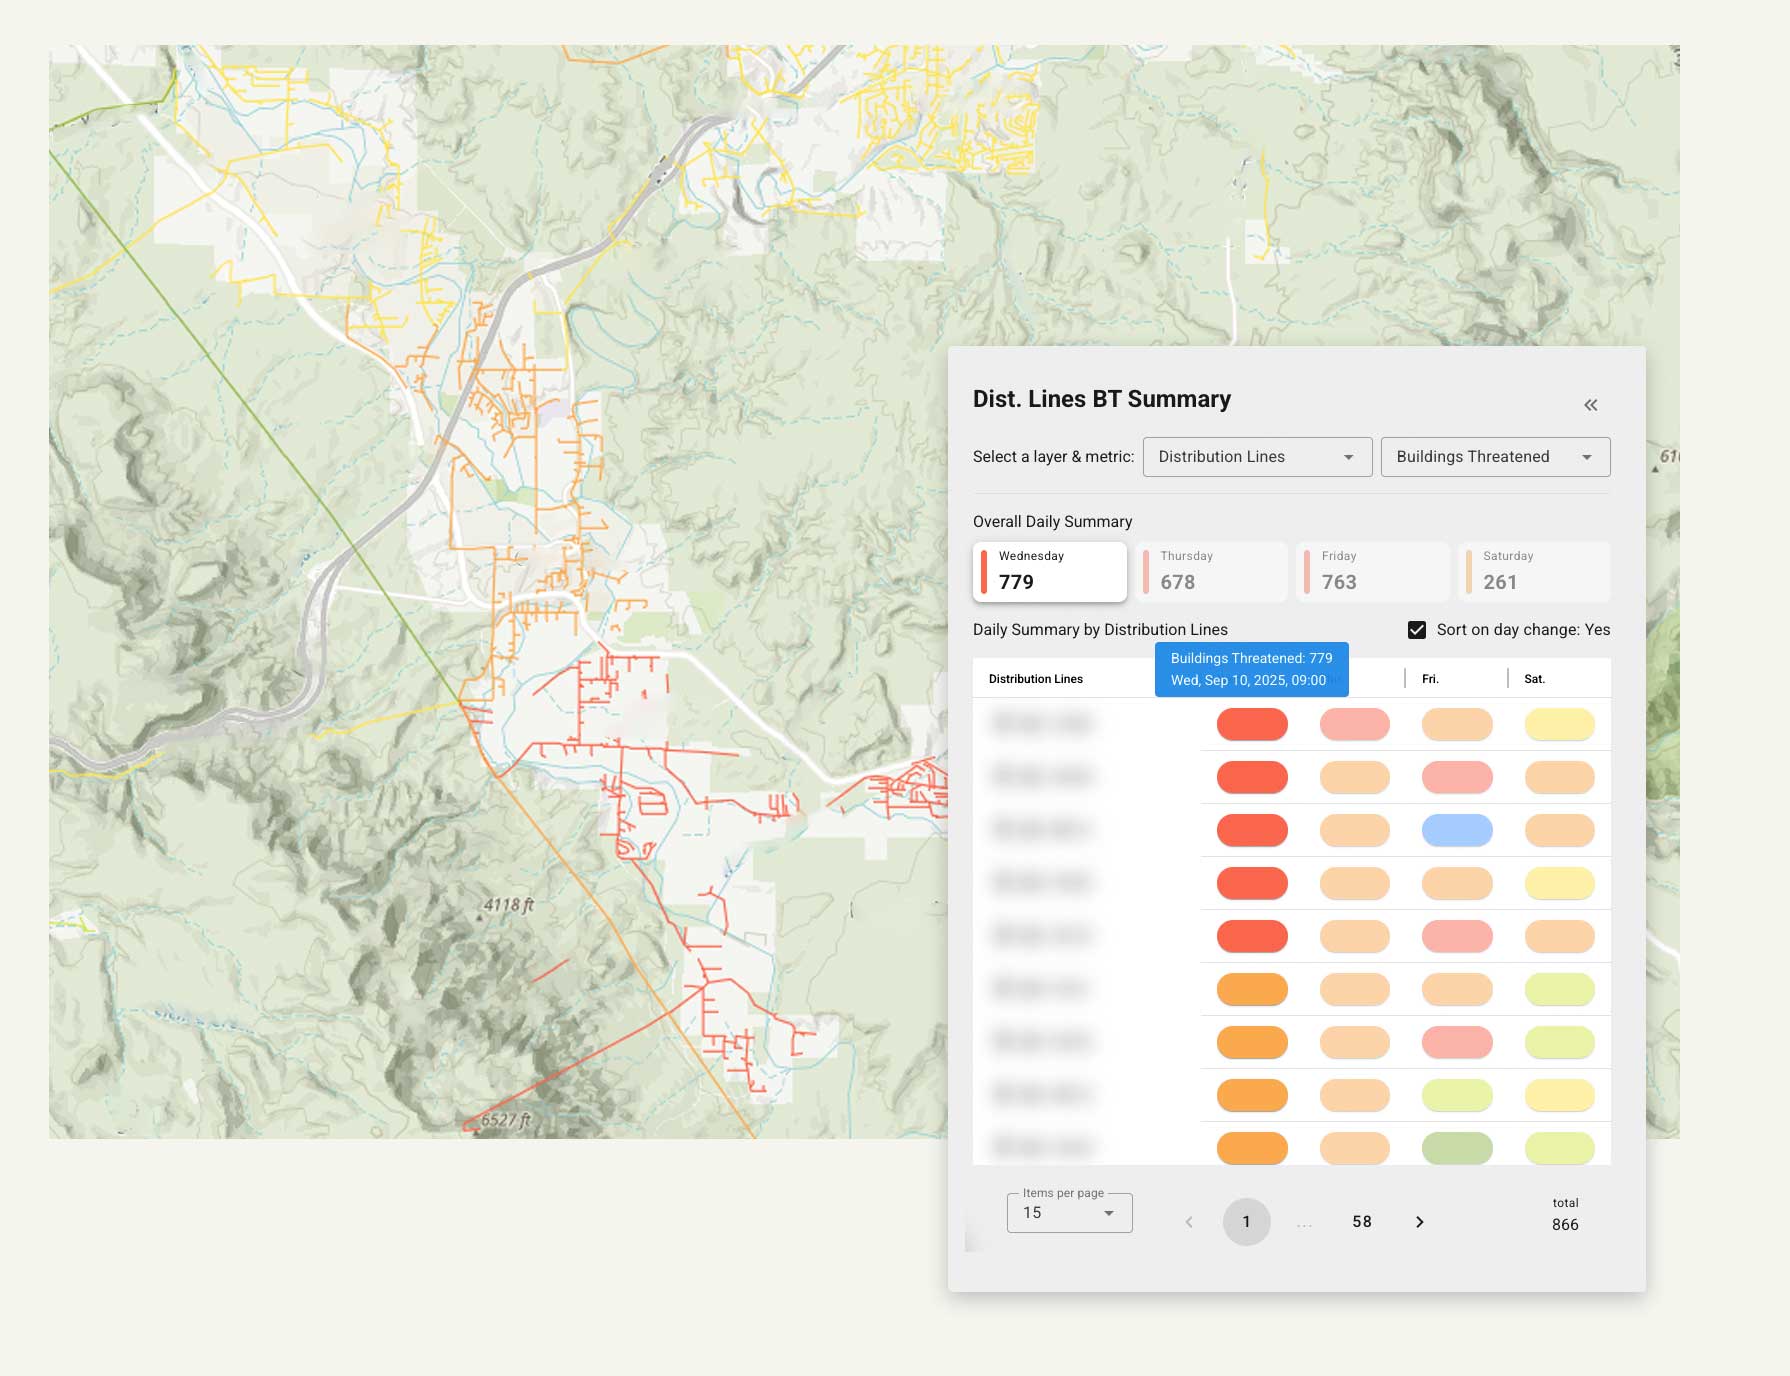
IMPACT AND CONSEQUENCE ANALYSIS
Know the outcomes.
See which asset will be impacted, when, and to what extent, and see the number of structures at risk of destruction to determine response priorities and tactics.
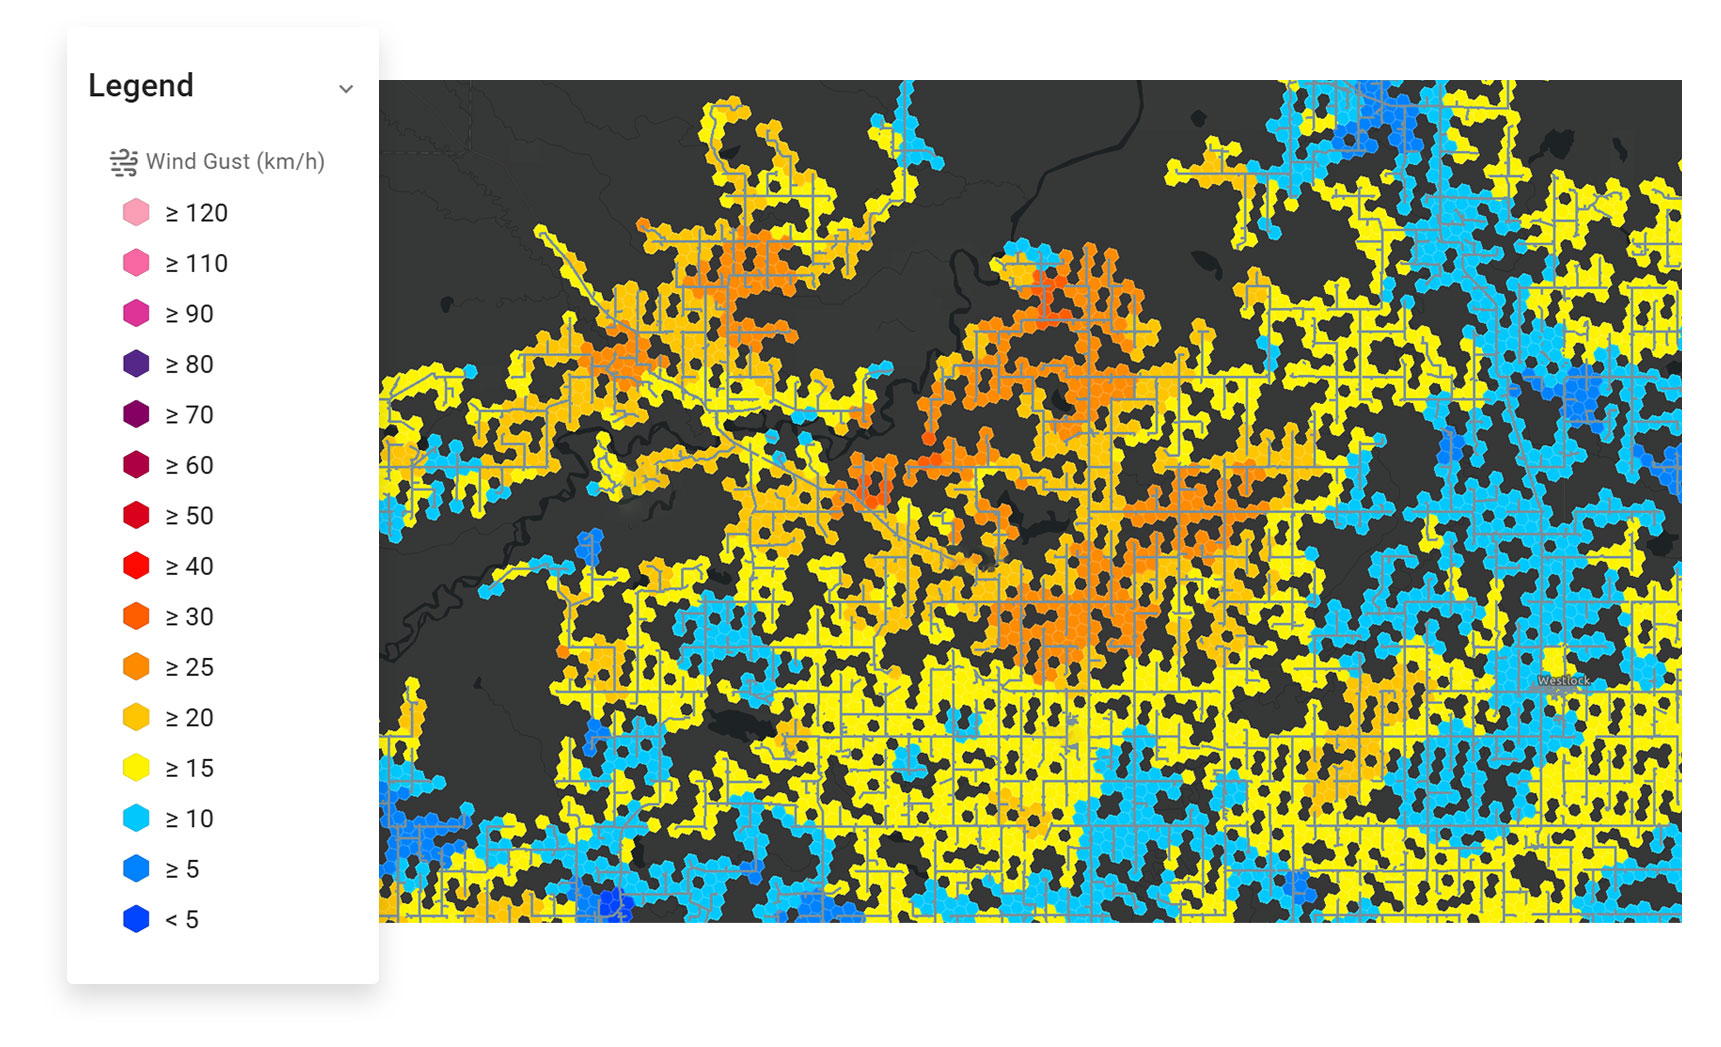
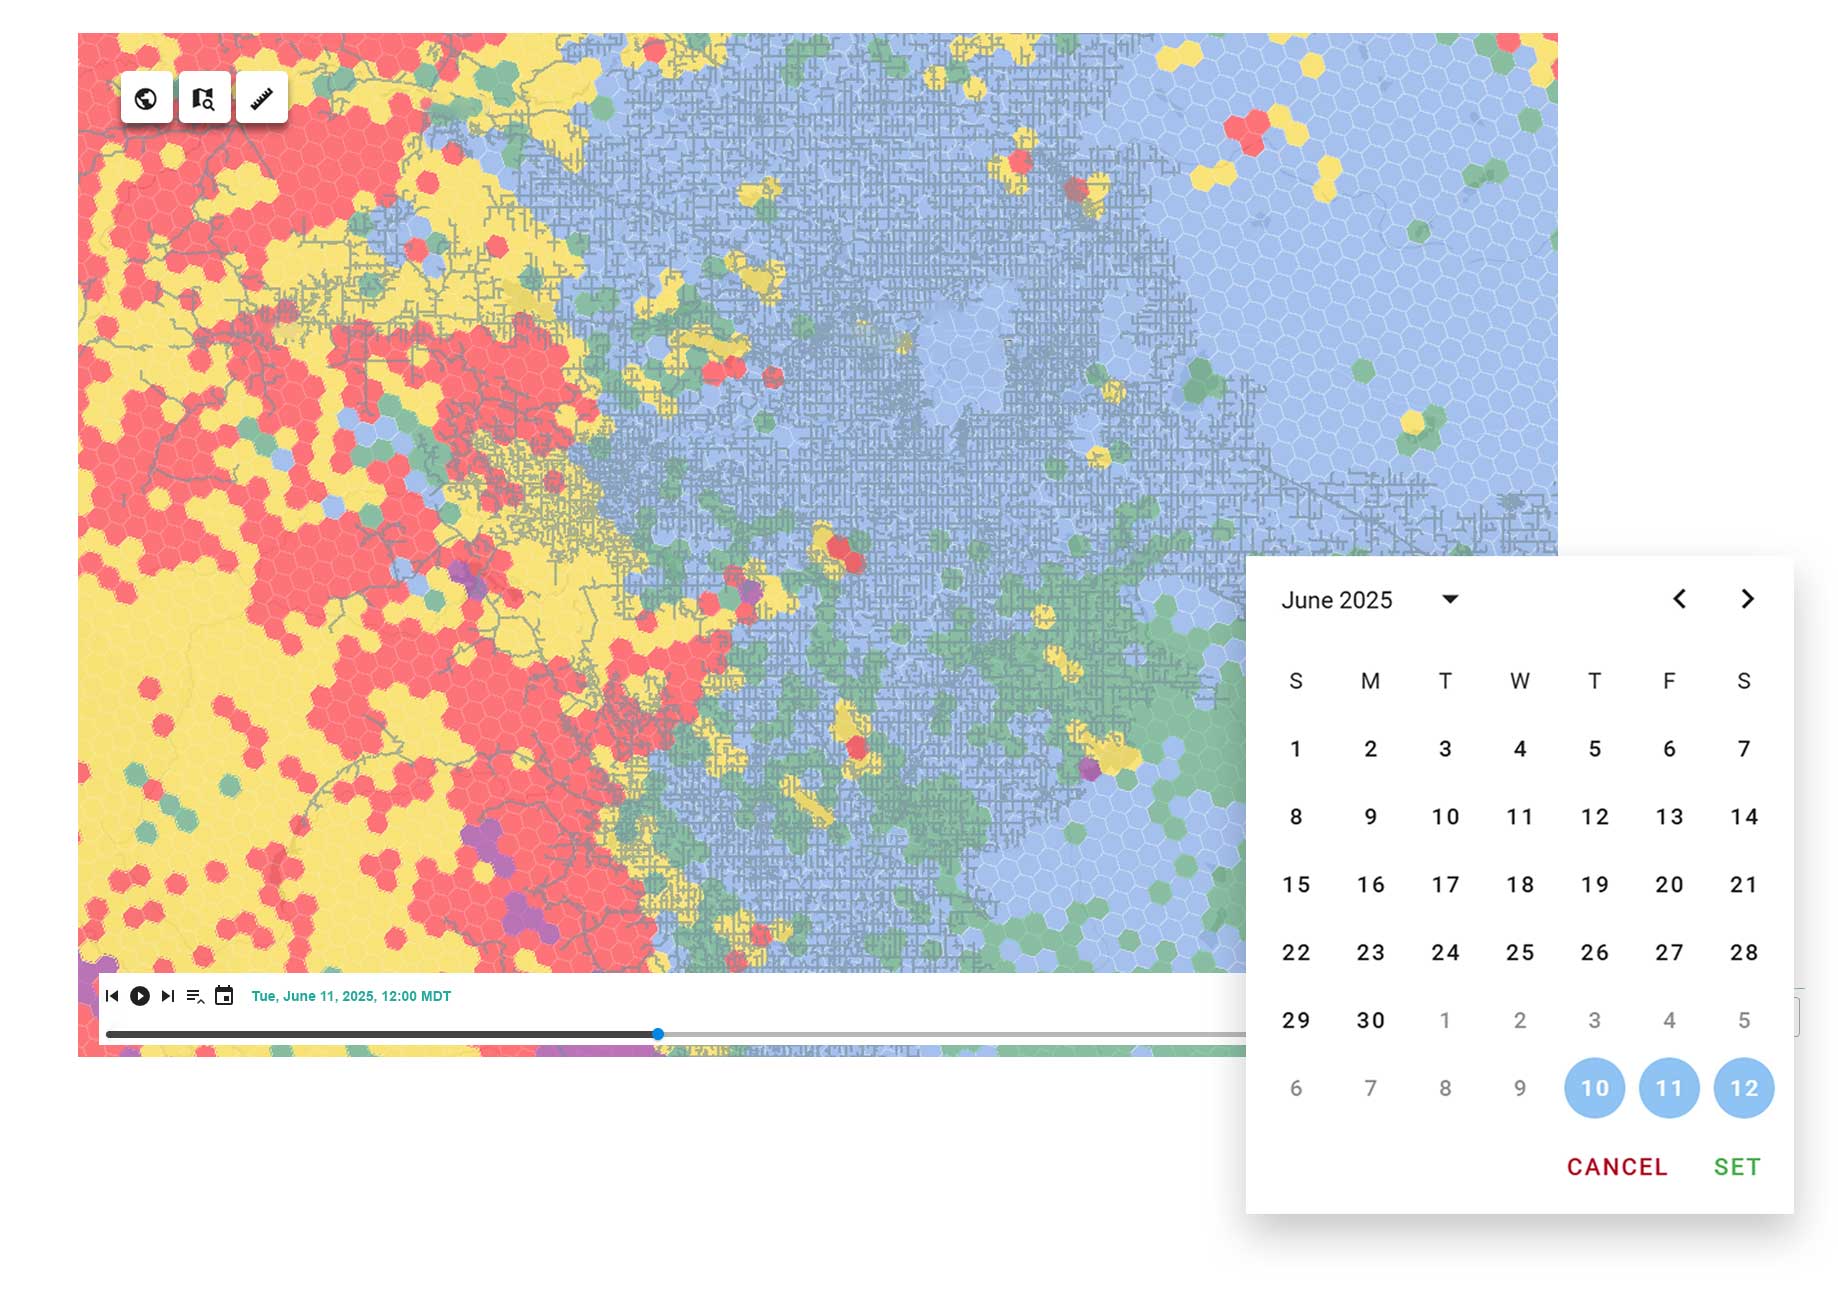
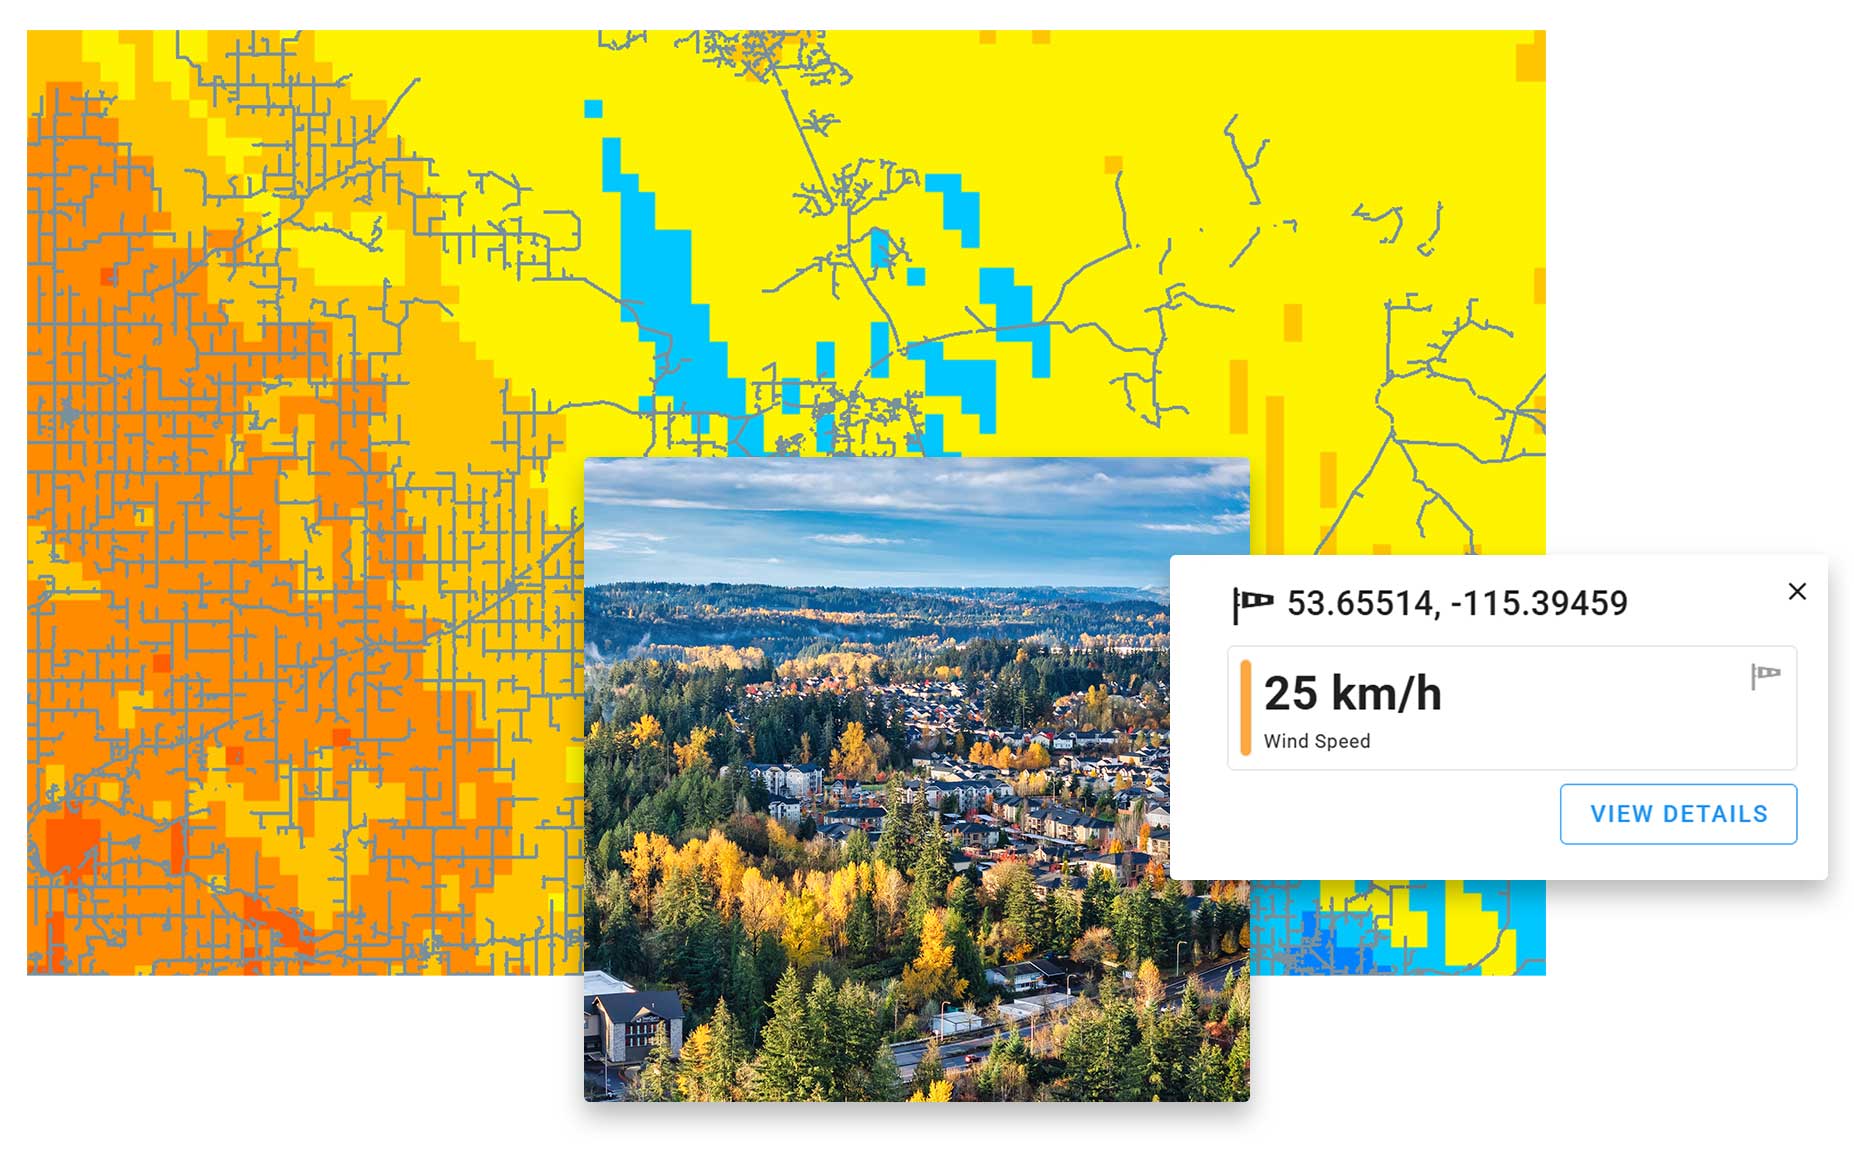
ENHANCED WEATHER PREDICTION
Assess changing conditions.
Tailored WRF models with wind gust and percentiles create 100+ hour weather forecasts at 2 km spatial and 1-hour temporal resolution, letting you identify future weather events and areas of concern.
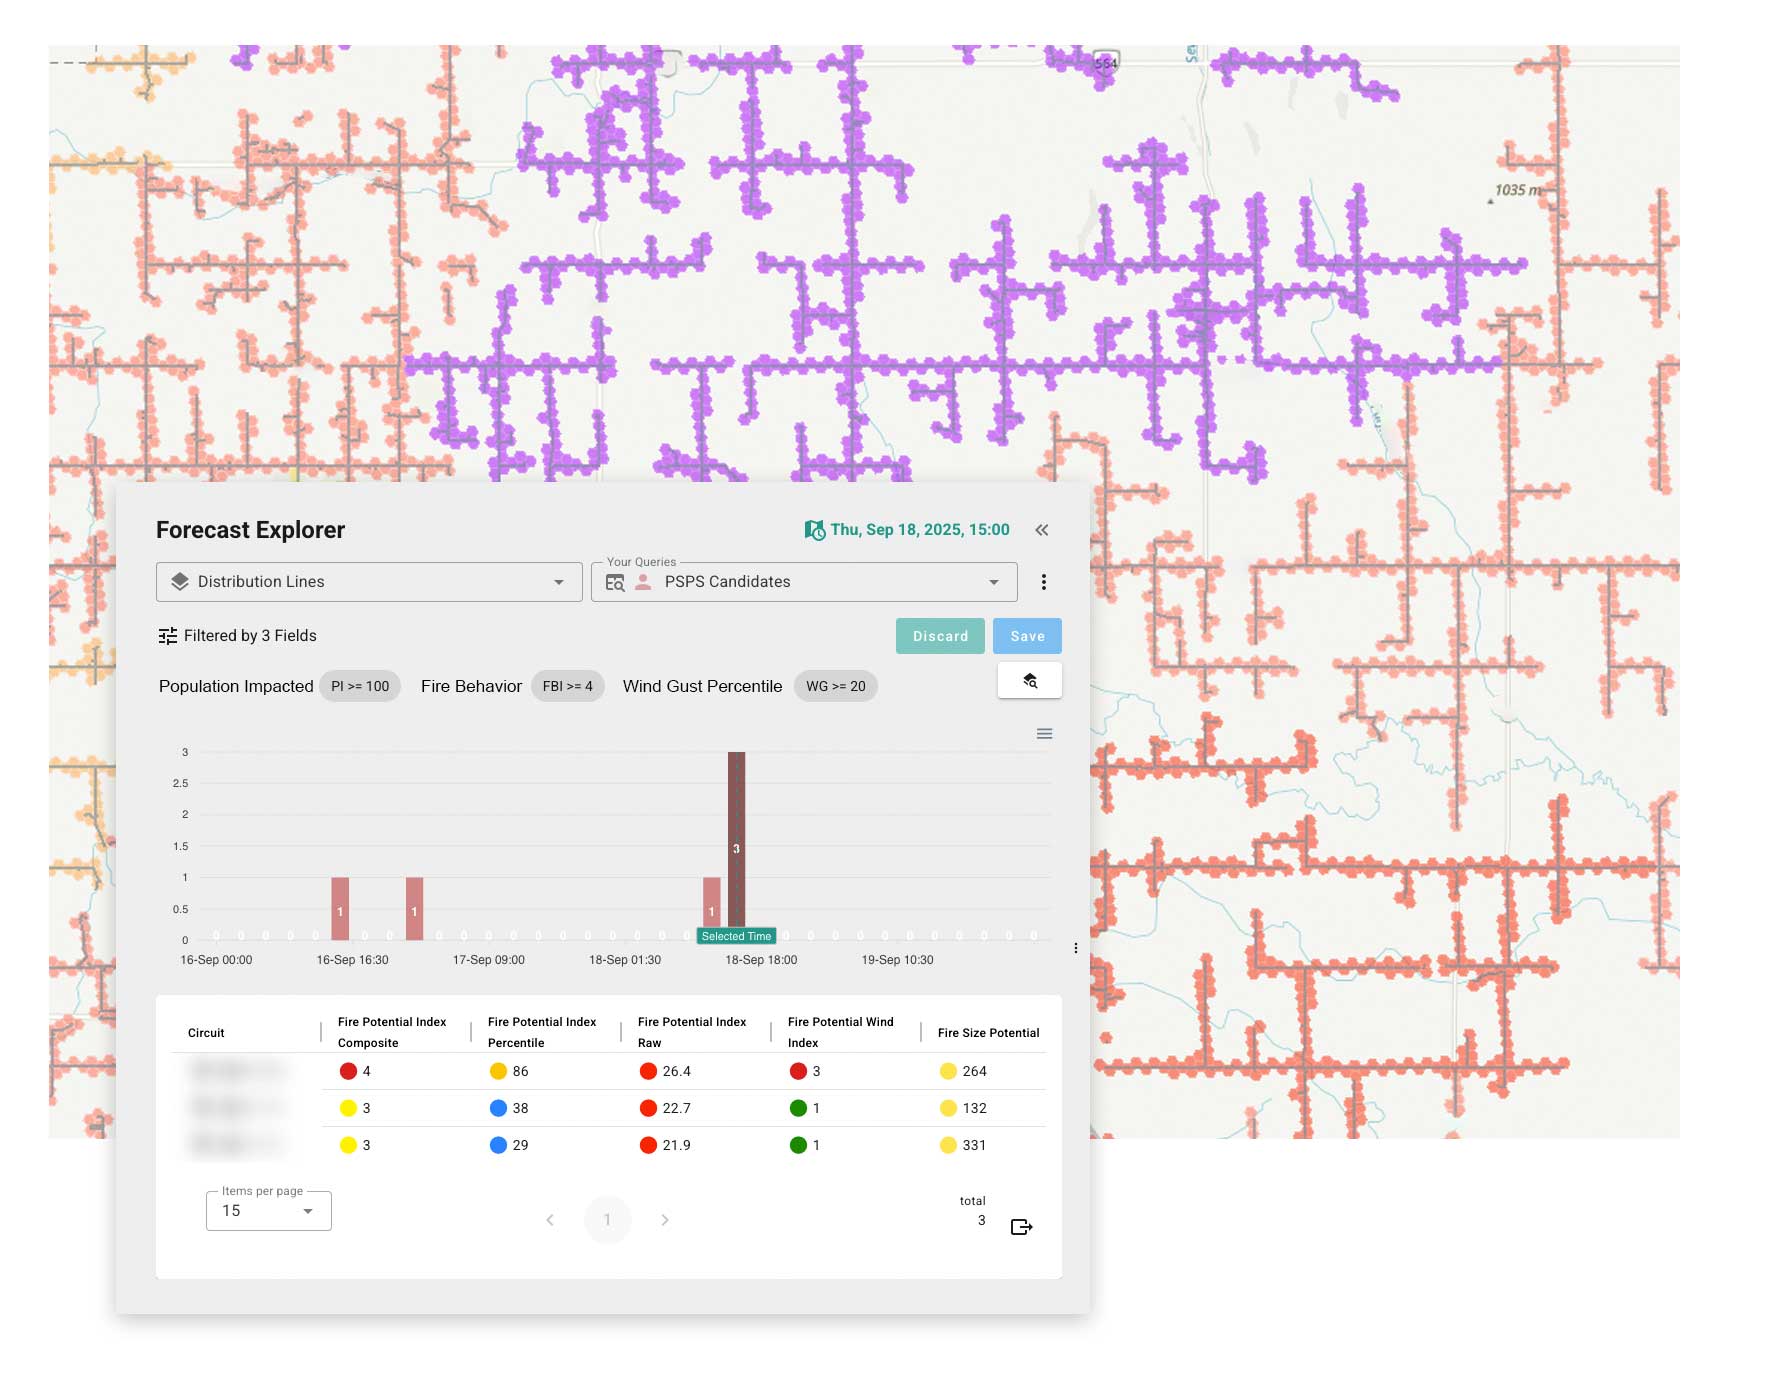
SURGICAL PSPS
Limit the disruption.
Avoid blanket de-energization that can affect thousands of customers unnecessarily. Highly detailed models provide specific, targeted power shutoff scenarios to preserve community resilience.
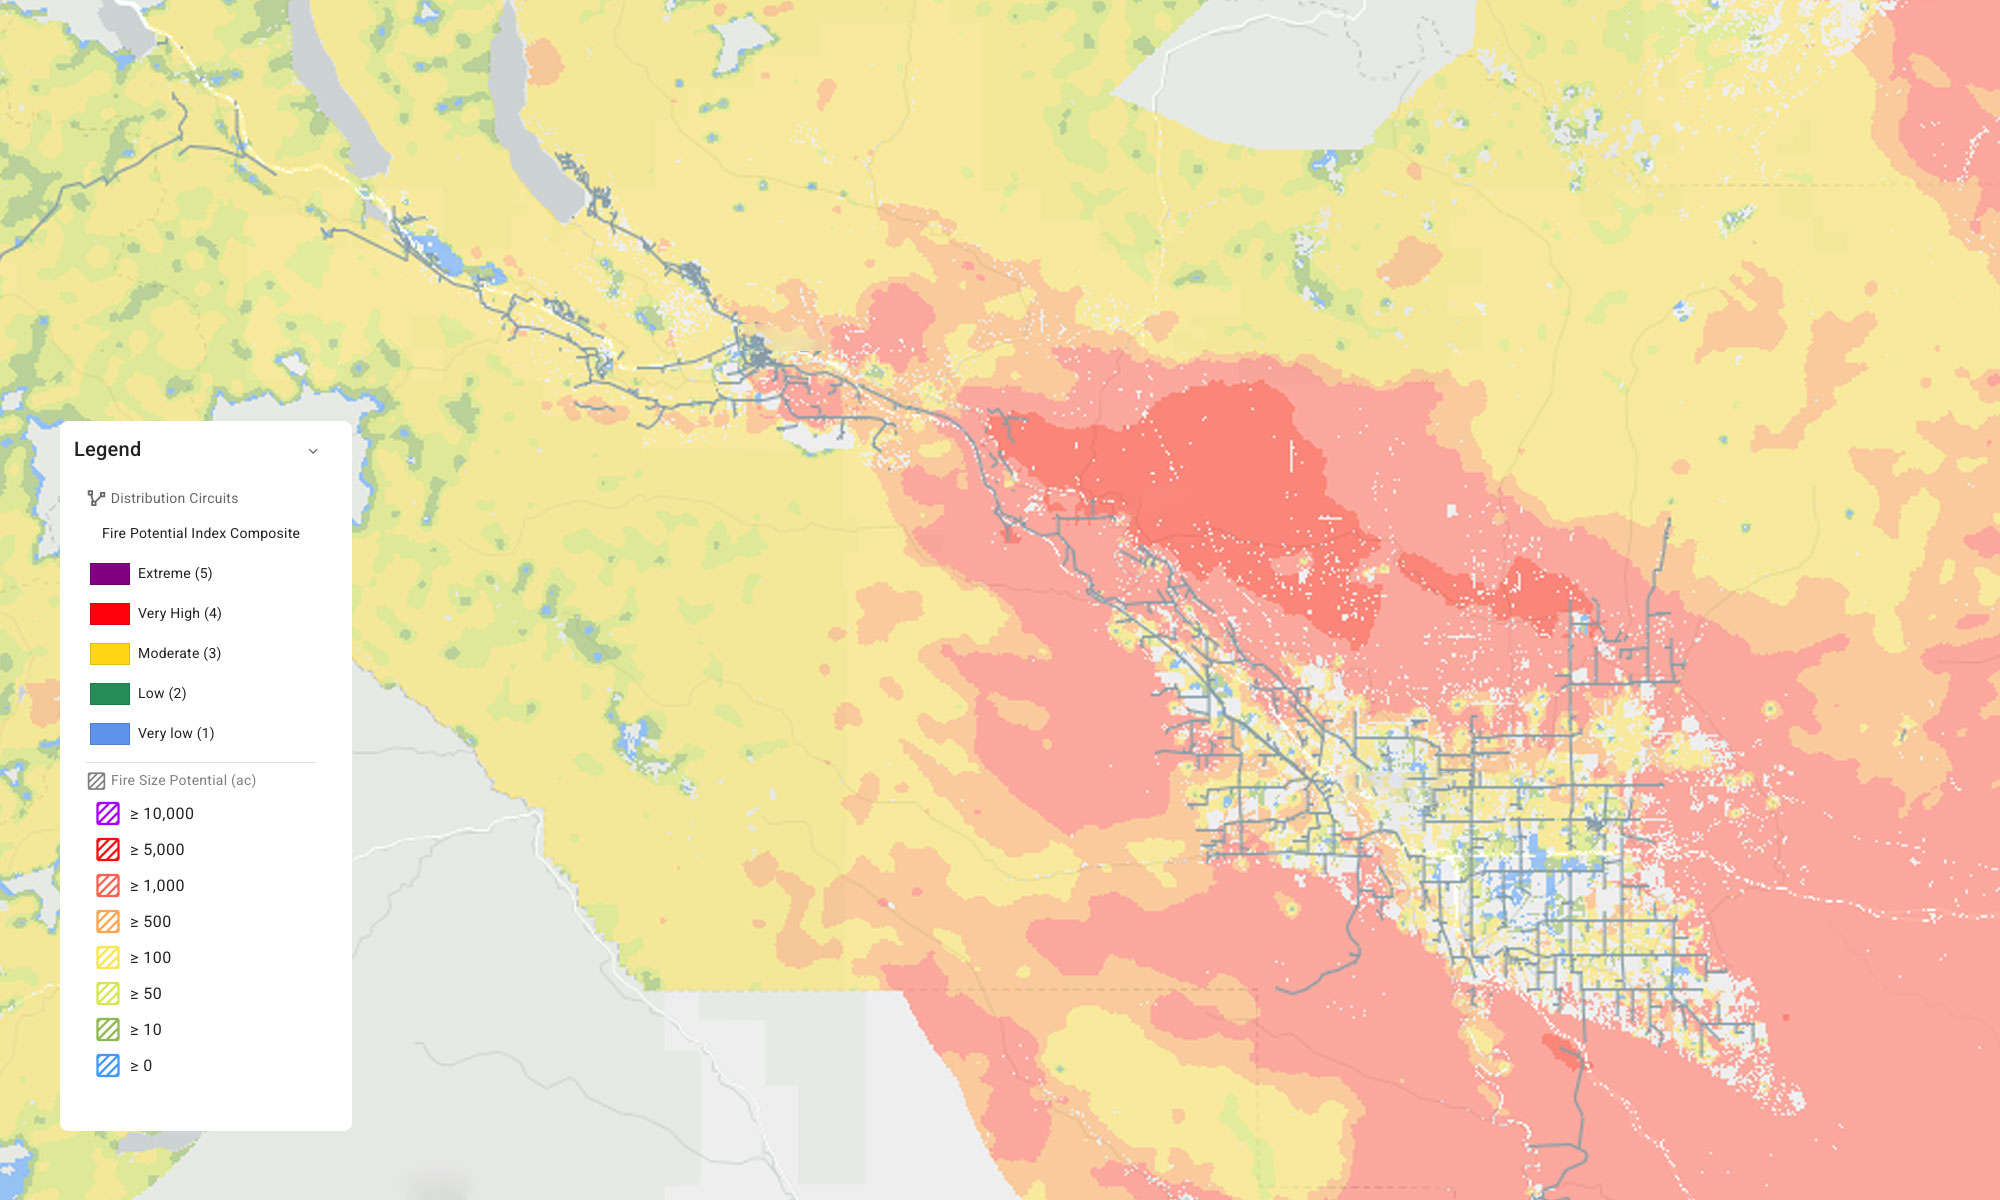
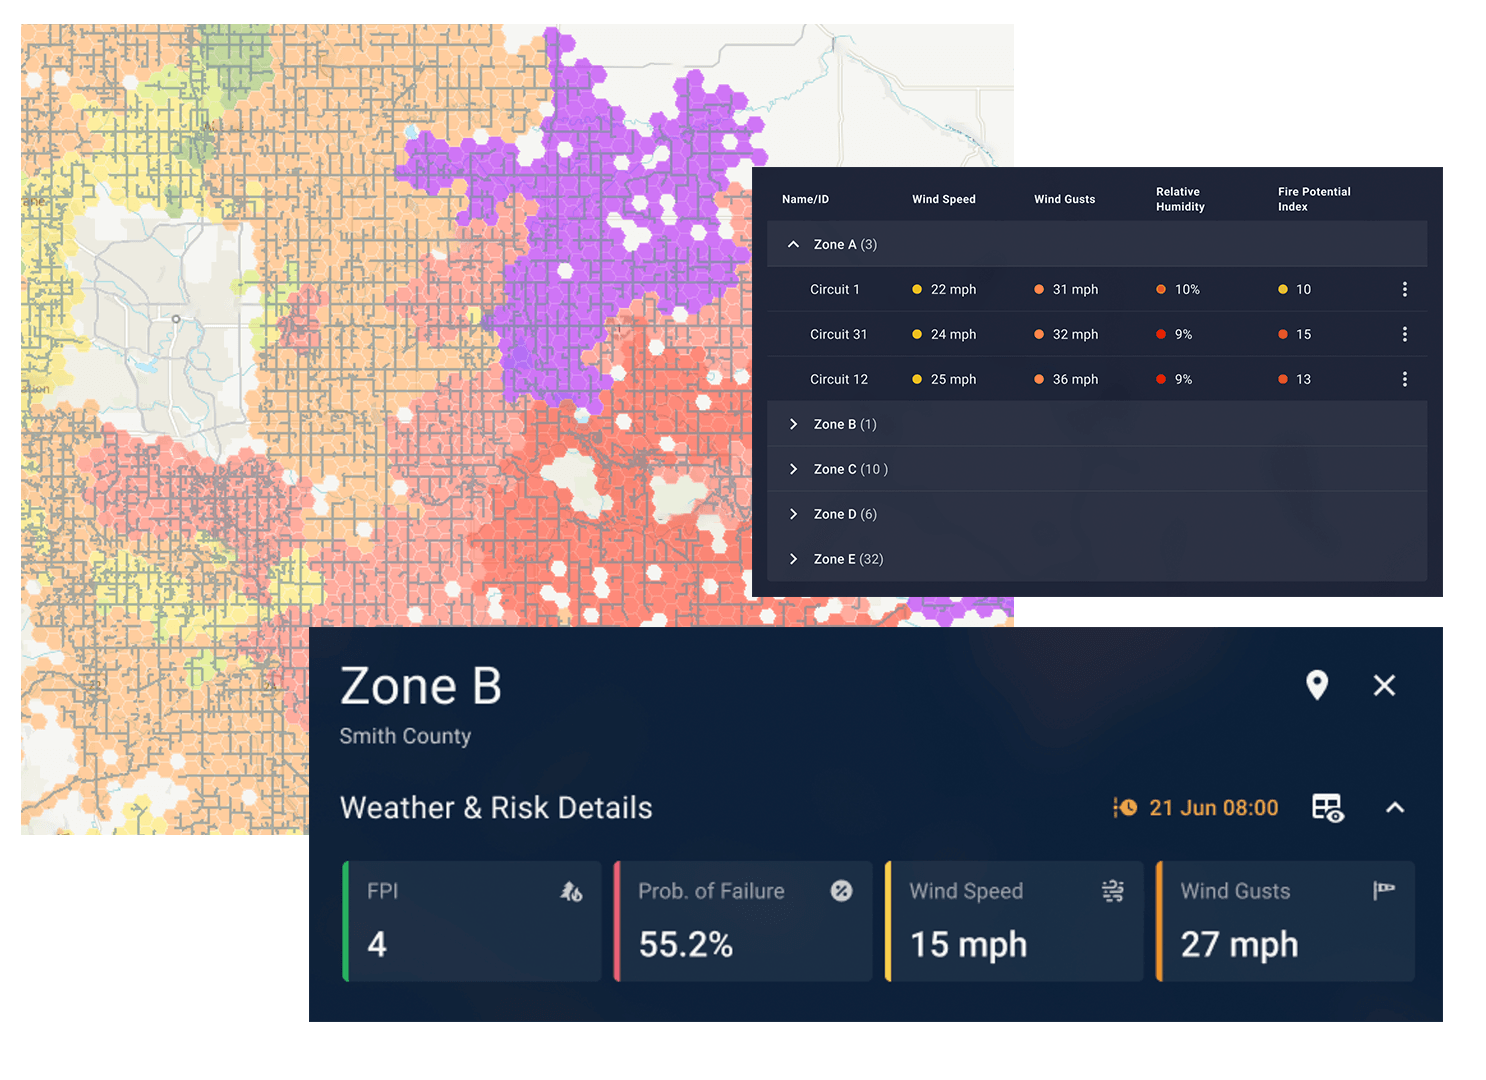
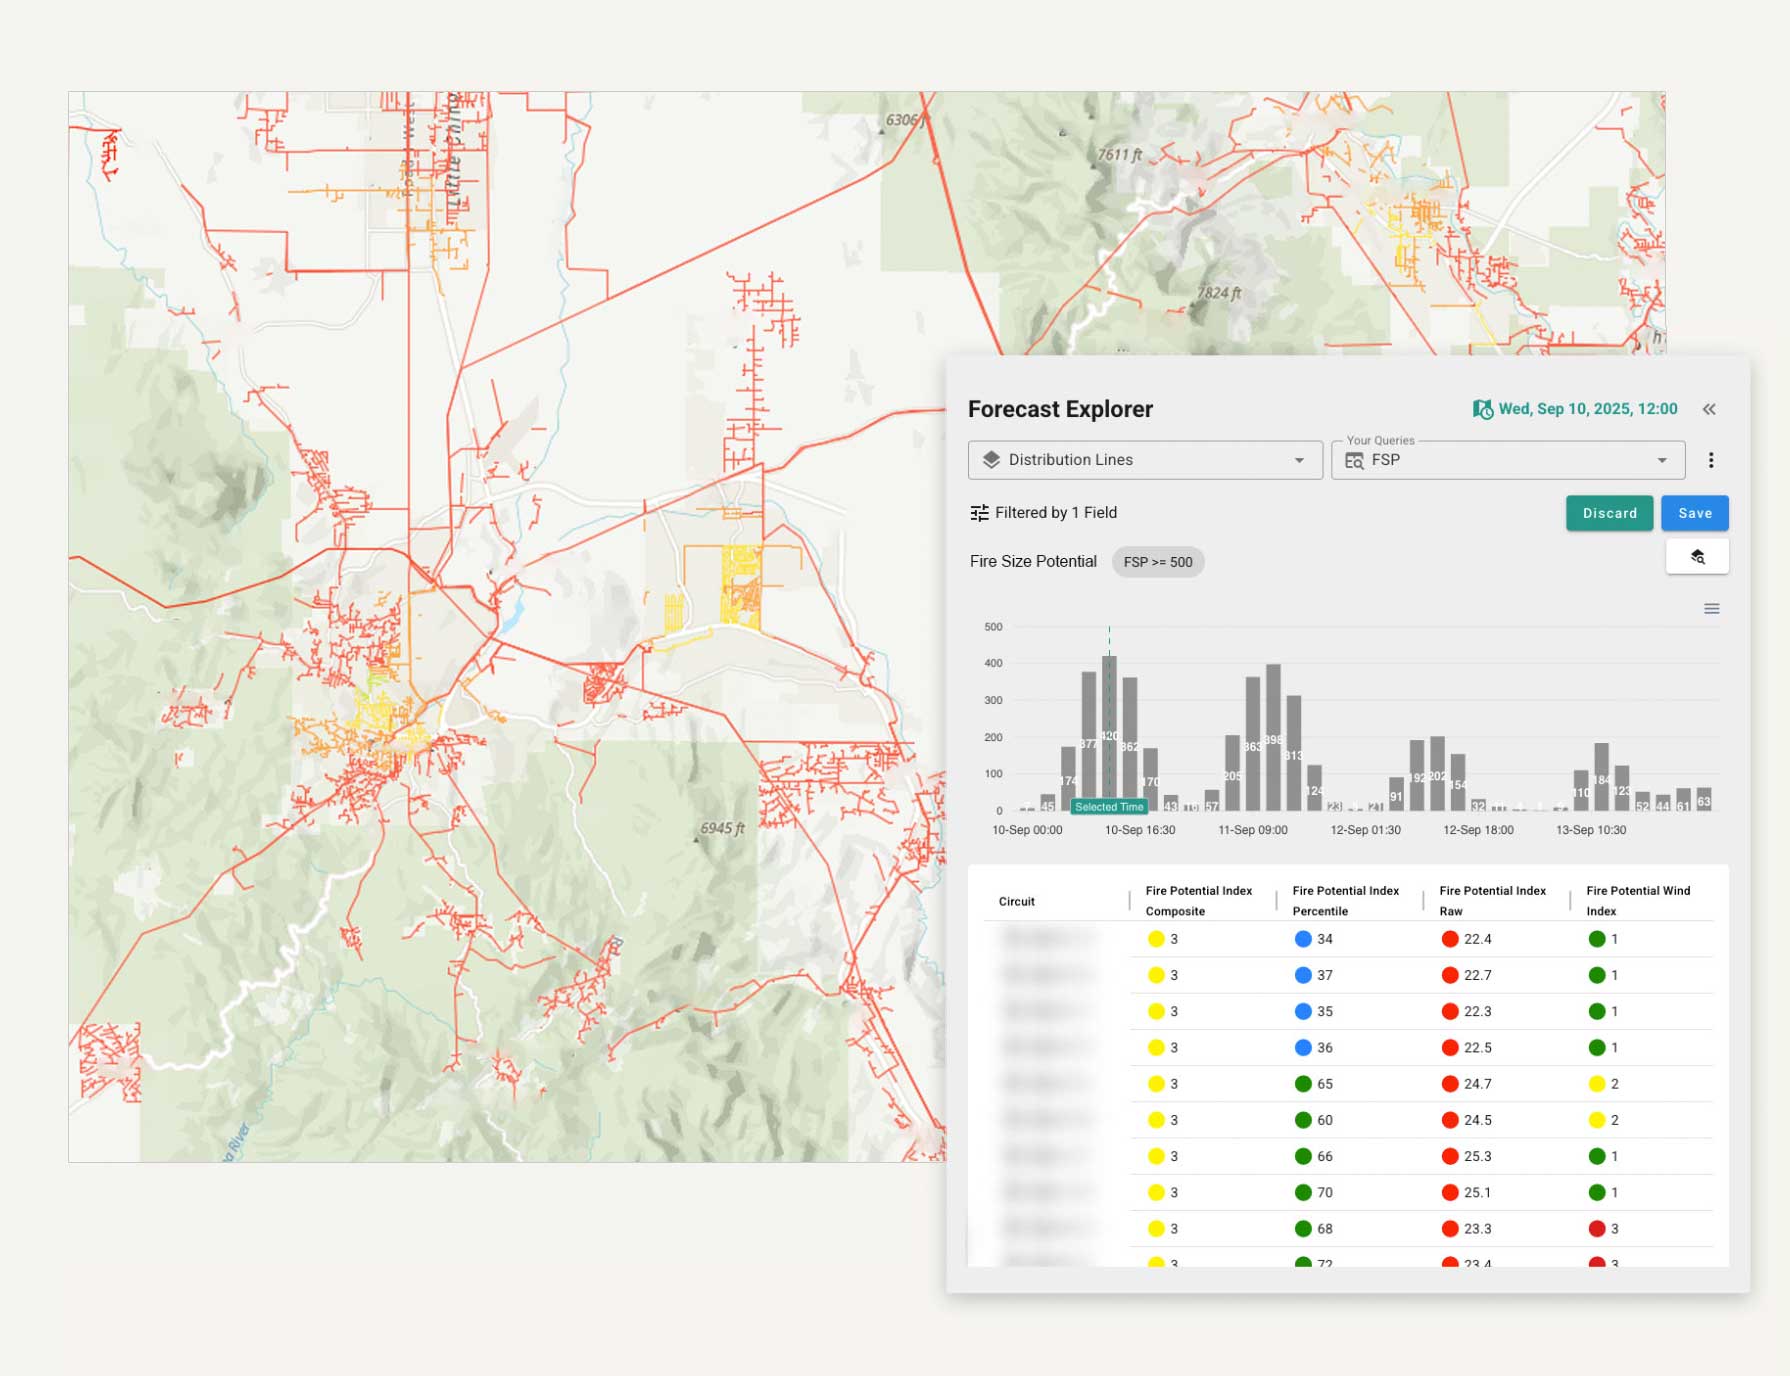
Choose your view.
The industry standard for quality predictive results, our models let you review data at both the territory and asset level, to get the full scope of details you need to make better decisions faster.
Measure what matters.
Our fire and extreme weather operations capabilities provide metrics that serve as the foundation for wildfire risk analysis. The seamless integration of key risk metrics into one source is essential to managing wildfire operations.
-
Identifies where fires will grow quickly given specific weather and fuel conditions
-
Assesses loss on an individual building basis to provide highly granular data
-
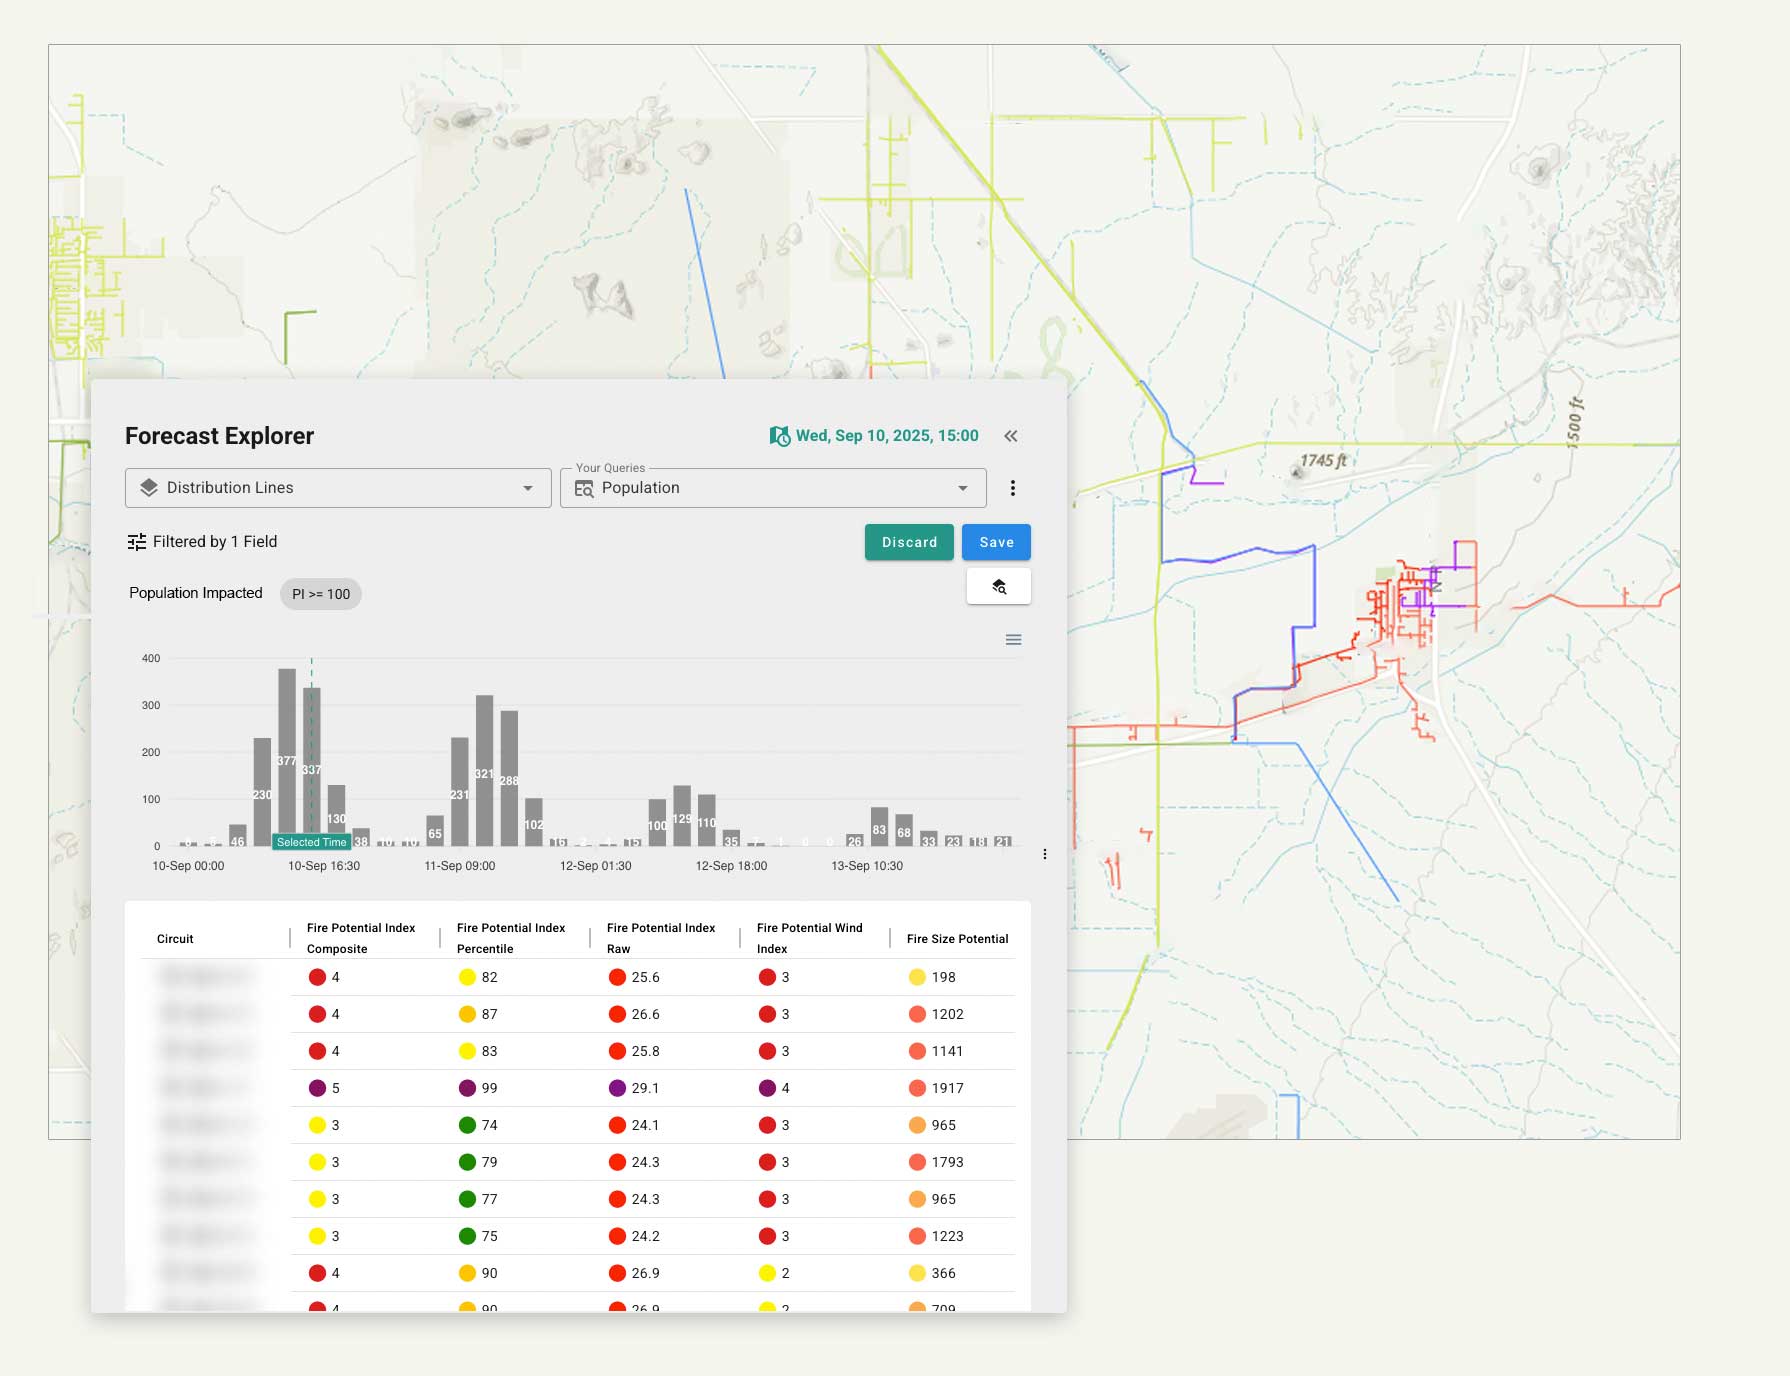
Identifies population at risk and supports evacuation planning process to improve community resilience
WILDFIRE MODELING
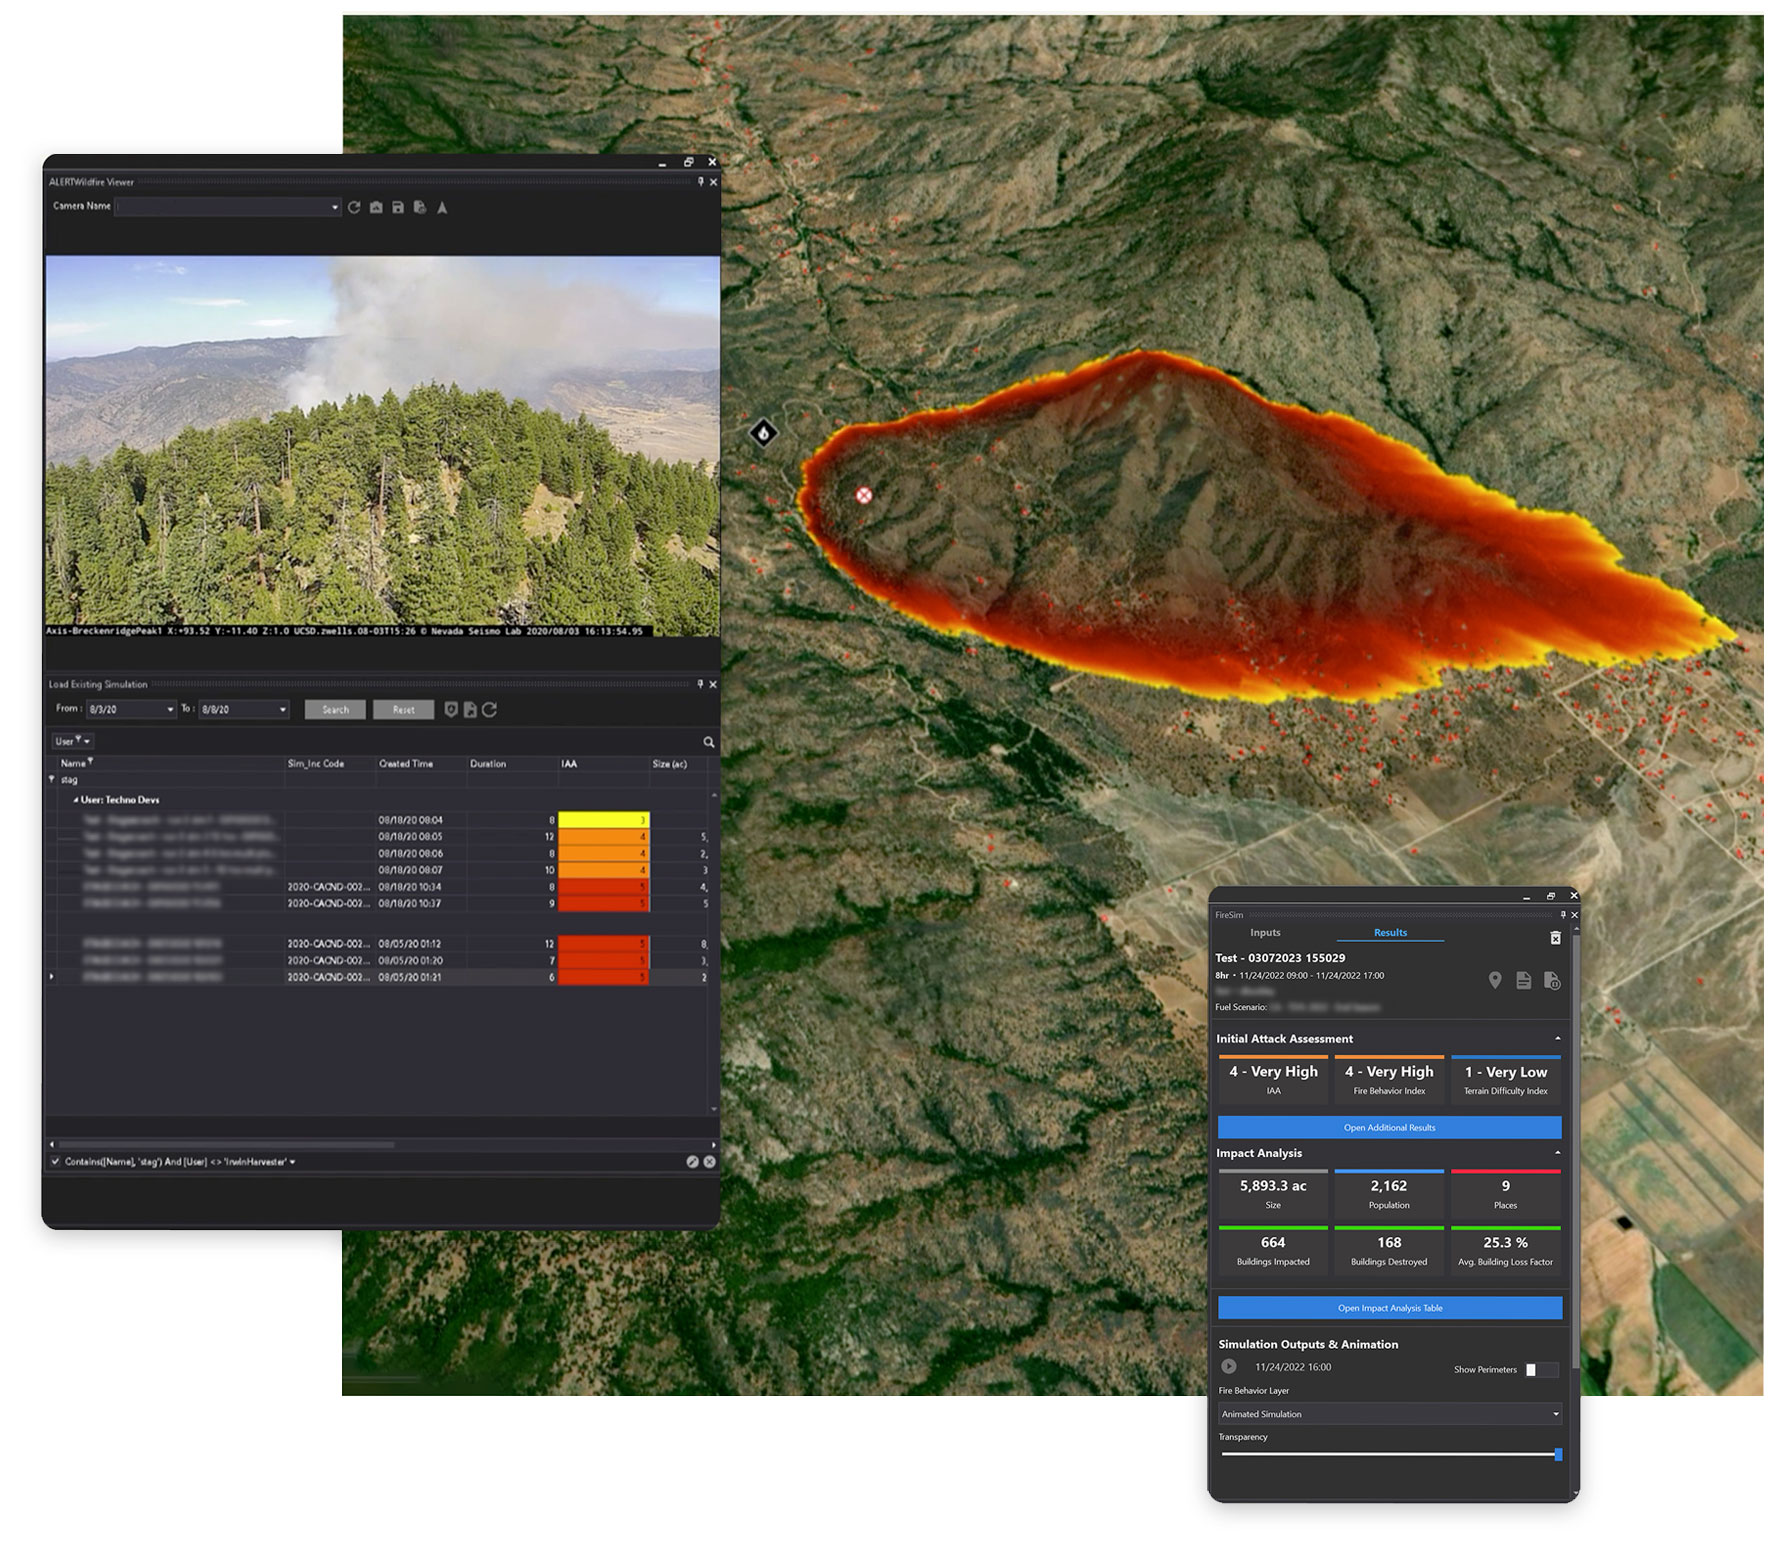
One platform. Results in under 30 seconds.
Our on-demand wildfire simulations are the engine behind it all. Letting you know a fire’s next move by instantly determining its path –these models make predictions in under 30 seconds and provide monitoring and updates on incidents in real-time.
Prevention and response tools in a single solution:
- Real-time monitoring to detect fires earlier and re-calibrate machine learning fire spread models
- Automatic impact and consequence analysis for people, structures, and assets
- CAD and IRWIN integrations for automatic spread predictions from all federal and state agencies
- Deterministic & probabilistic simulations to incorporate uncertainty and identify vulnerable areas
- Advanced WUI encroachment to evaluate where wildland fuels meet human development
- Detailed simulation reports to see technical fire behavior outputs across the modeled area